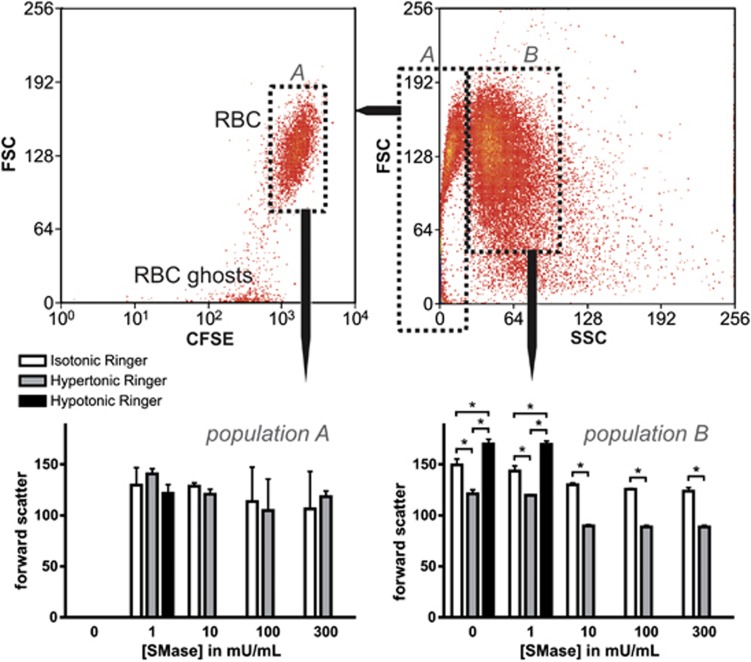
Figure 5.
Osmotic responsiveness and fragility of SMase-treated erythrocytes. CFSE-labeled erythrocytes from three healthy volunteers were treated with increasing activities of SMase for 15 min at 37 °C, and subsequently incubated with hypotonic, isotonic-, and hypertonic buffer for 15 min at room temperature. The cells were analyzed by flow cytometry. A forward/sideward scatter (FSC and SSC, respectively) density plot of SMase-treated erythrocytes is shown in the upper right. A FSC/CFSE density plot of erythrocyte subpopulation A is shown in the upper left. Forward scatter of subpopulations A and B are depicted in the bottom graphs. Populations of<2500 cells are not shown in the graphs. The graphs present mean values, error bars represent S.D., and *P<0.05

