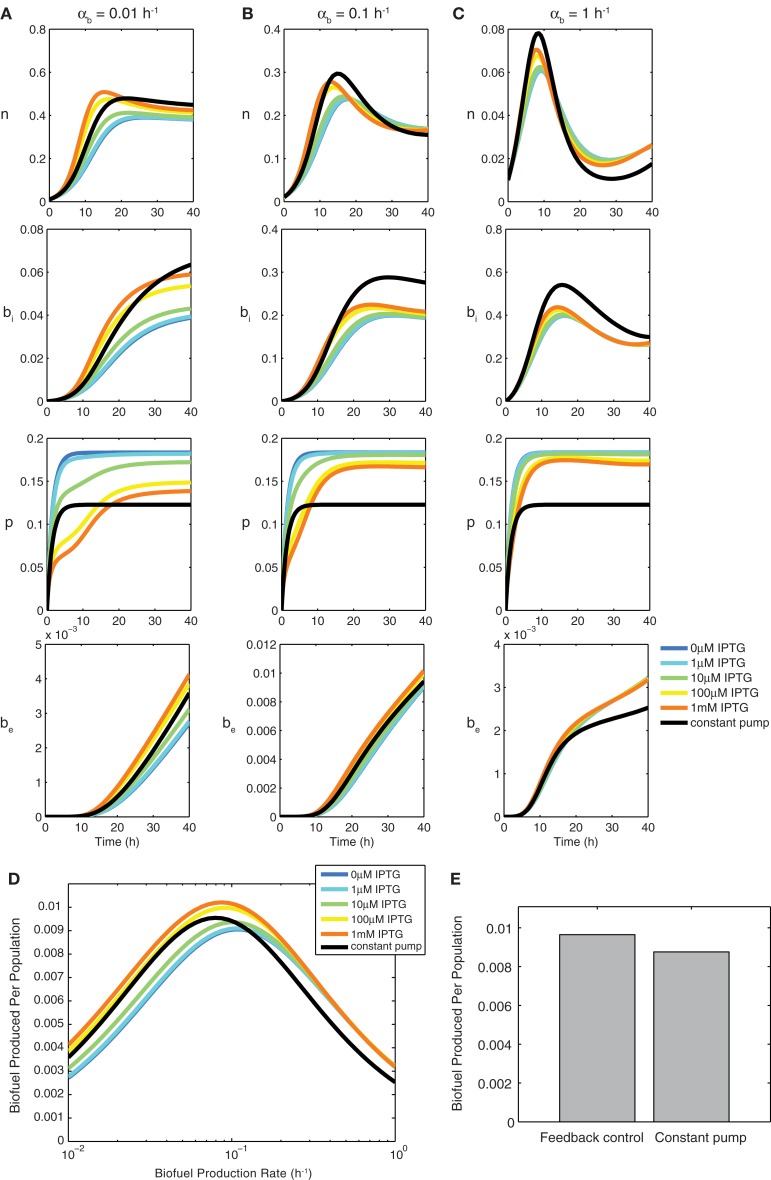
Figure 3.
Constant pump versus feedback control model using a biosensor. Transient behavior for growth n, intracellular biofuel bi, pump expression p, and extracellular biofuel be for biofuel production rates αb of (A) 0.01 h−1, (B) 0.1 h−1, and (C) 1 h−1. Note the differences in y-axis scales. (D) Relative biofuel produced per population as a function of biofuel production rate. (E) Relative biofuel produced per population when the model parameters are variable.

