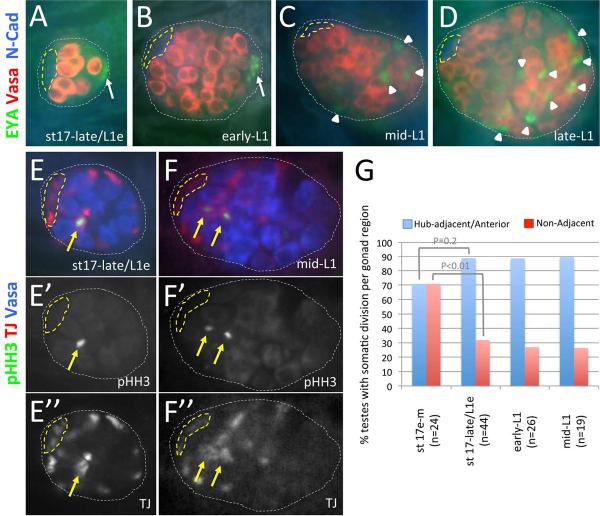
Figure 3. CySC division and cyst differentiation are observed by mid-L1.
Late-stage embryonic and 1st instar larval testes immunostained with anti-Vasa (A–D, red; E, F, blue), either anti-Eyes Absent (EYA; A–D, green) to detect cyst cells and msSGPs or anti-phosphorylated-Histone-H3 (pHH3; E, F, green; E', F' alone) to detect mitotic chromatin, and either anti-N-Cadherin (N-Cad; A–D, blue) to detect the hub or anti-TJ (TJ; E, F, red; E”, F”, alone) to detect somatic gonadal cells. Images oriented with anterior to the left. Hub (yellow dashed lines) and testes (white dotted lines) outlined. [A–D] Testes at the embryo-larval transition (A) and early-L1 (B) with EYA expressed in male-specific somatic gonadal precursors (msSGPs; white arrows). Mid-L1 (C) and late-L1 (D) testes with EYA detected in somatic nuclei in the posterior half of the gonad (white arrowheads) where spermatogonia are known to form. [E, F] Testes at the embryo-larval transition (E) and mid-L1 (F) with pHH3 detected in somatic cells adjacent to the hub (yellow arrows). [G] Graph showing the percentage of pHH3/TJ double positive testes over time with pHH3 detected in somatic cells adjacent to the developing hub (in the anterior half of the testes in early-mid stage 17 embryos) or in cells elsewhere in the testes (Non-Adjacent). P-values from Chi-squared analyses are shown.

