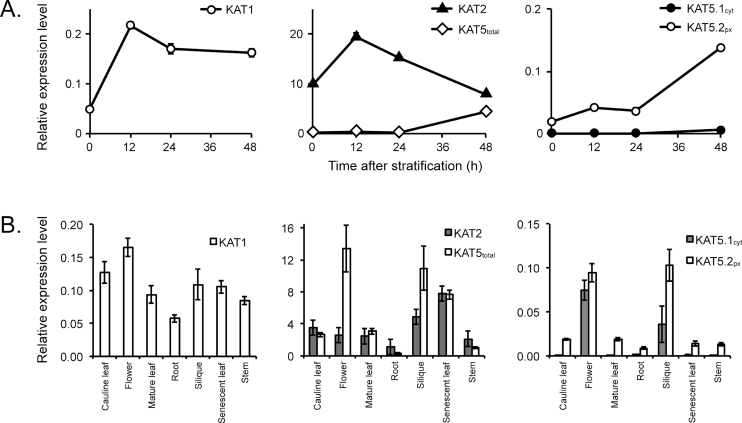
Fig. 5.
Quantitative RT-PCR analysis of KAT transcript abundance in Arabidopsis thaliana. (A) KAT transcript abundance during germination. (B) Relative expression of KAT transcripts in different plant organs. The abundance of KAT1, KAT2, KAT5total, KAT5.1cyt. and KAT5.2px transcripts was measured and normalized to reference gene (CACS) transcript levels. Error bars represent standard error from the mean (n=4).

