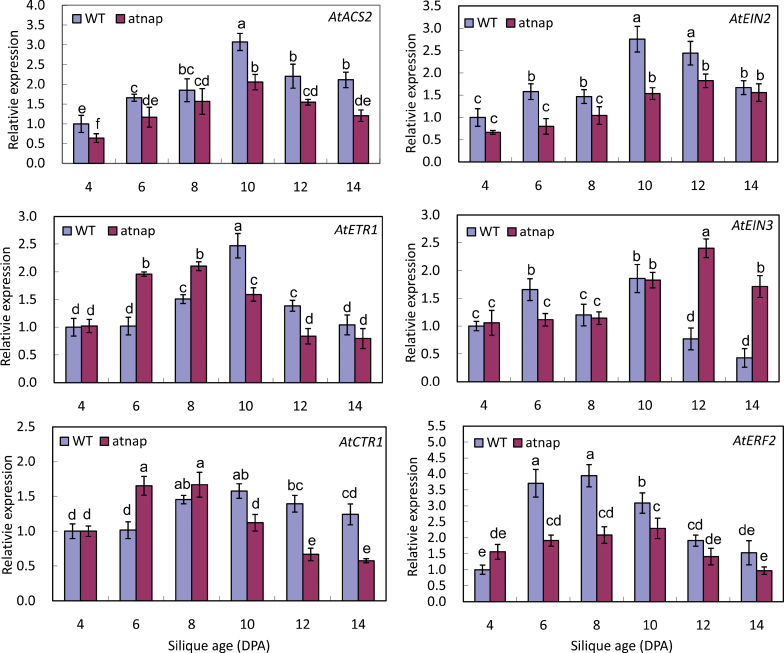
Fig. 8.
Expression levels of genes involved in ethylene biosynthesis, perception, and signal transduction in siliques of WT and the atnap mutant during development and senescence. qPCR analyses were performed. Relative expression levels were calculated and normalized with respect to Actin 2 (ACT2) transcripts. Four independently isolated RNA samples at each time point were used. Bars are means ±SD (n=4). Significant (P=0.05) differences between means are indicated by different letters.

