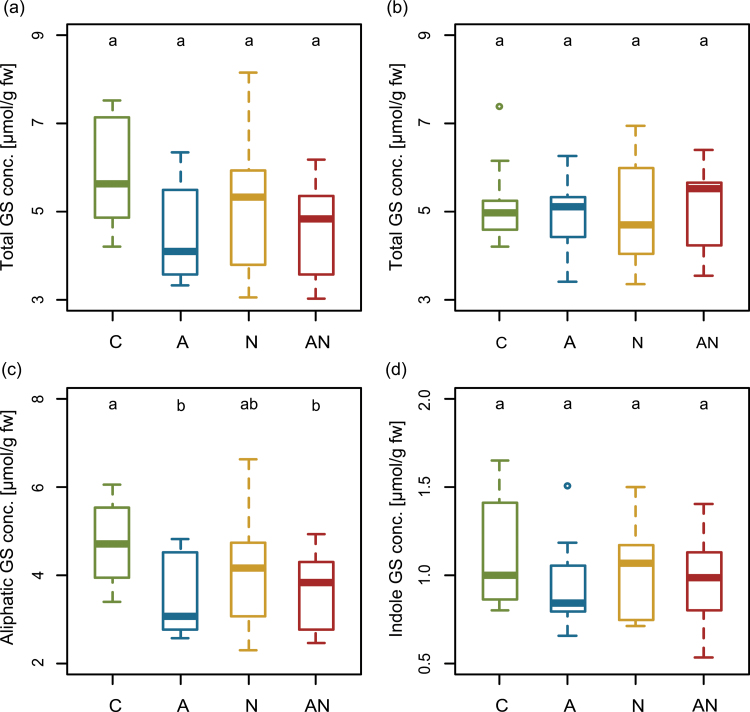
Fig. 1.
Total glucosinolate (GS) concentrations (conc.) in (a) shoots and (b) roots and concentrations of (c) aliphatic and (d) indole GS in the shoots of control (C)-, aphid (A)-, nematode (N)-, and aphid + nematode (AN)- treated Arabidopsis thaliana plants at 3 days after infestation. The horizontal line in the boxes indicates the median, the boxes indicate the 25% and 75% percentiles, the whiskers extend to the lowest and highest value within the 1.5 × interquartile range, respectively, and values outside that range are depicted as dots. Different lowercase letters indicate significant differences at P < 0.05 (analysed with GLM, n = 10 per treatment; data are shown from one representative experiment of three independent experiments) (this figure is available in colour at JXB online).

