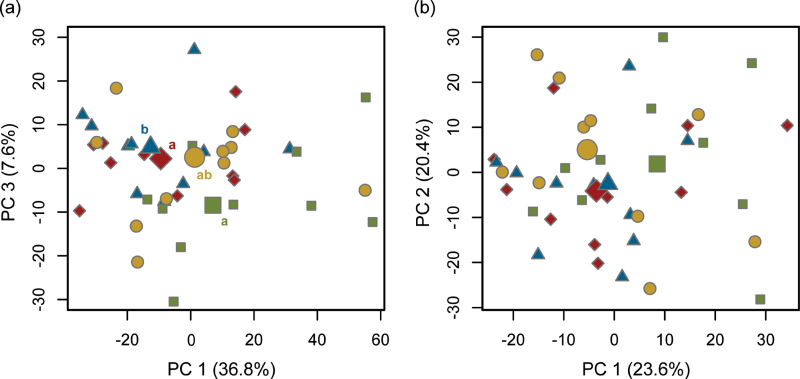
Fig. 3.
PCA scores plot of metabolic fingerprints of Arabidopsis thaliana from (a) shoots and (b) roots of control plants (green boxes) and plants under different herbivore impact (aphid, blue triangles; nematode, yellow circles; aphid + nematode, red diamonds; n = 10 per treatment; data are shown from one representative experiment of three independent experiments). Large symbols represent the score median of each treatment group. The percentage of total variance explained by the given principal component is declared in brackets. Different lowercase letters in (a) indicate significant differences at P < 0.05 between the scores of the orthogonal PC1–PC3 axes (analysed with Kruskal–Wallis tests followed by nonparametric Tukey post-hoc tests). No significant differences were found for root fingerprints.

