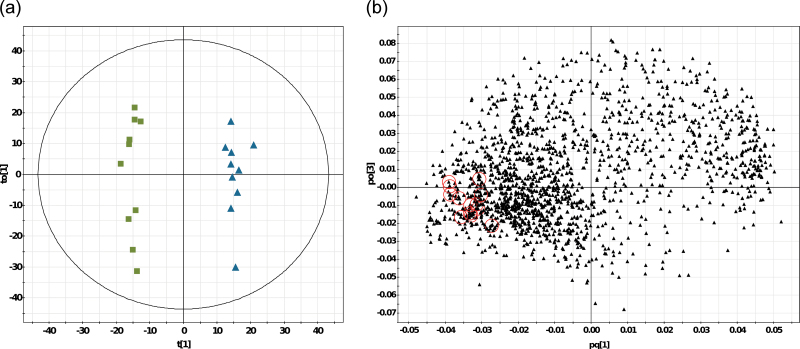
Fig. 4.
OPLS-DA of metabolic fingerprints of Arabidopsis thaliana. (a) Scores plot of shoots of control plants (green boxes) and aphid-treated plants (blue triangles) (n = 10 per treatment; data are shown from one representative experiment of three independent experiments). The tolerance ellipse corresponds to 95% of the Hotelling’s T2 multivariate distribution. (b) Loadings plot. Red circles = identified glucosinolates with VIP > 1. The features at the left side were more abundant in the control plants compared to the aphid-treated plants, and vice versa (this figure is available in colour at JXB online).

