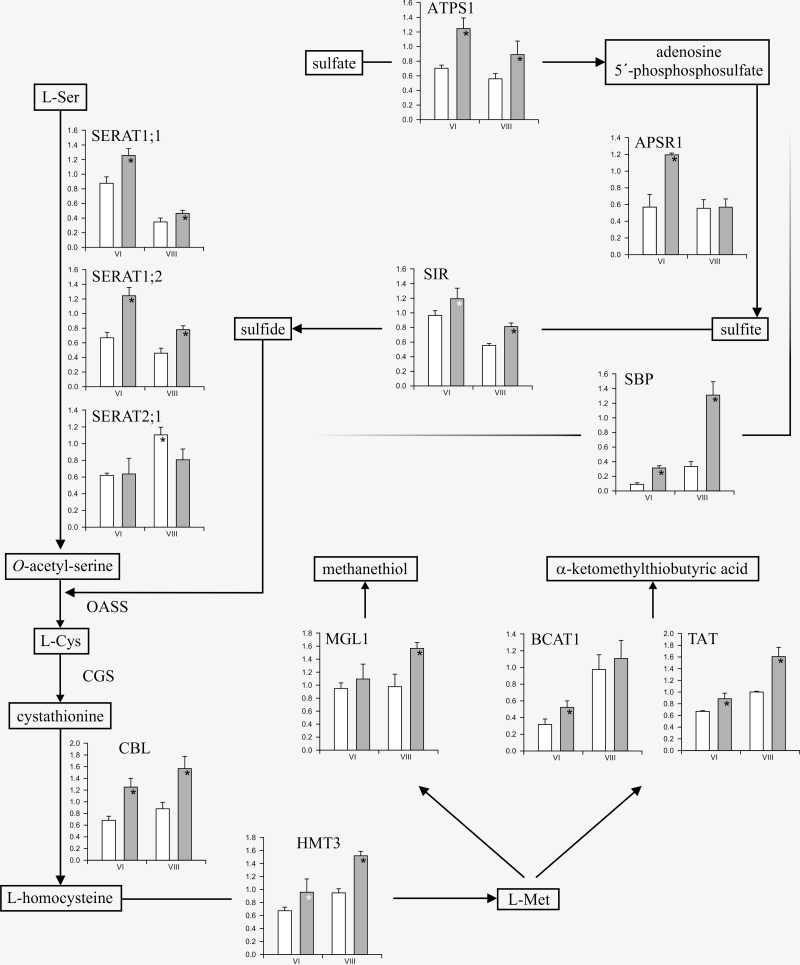
Fig. 2.
Differential expression of genes in sulphur amino acid pathways in developing seeds of SARC1 and SMARC1N-PN1. Relative transcript expression was determined by reverse transcription-quantitative PCR. Data were normalized to the mean C q of the reference gene, ubiquitin. Values are the means of three biological replicates ± standard deviation, with each biological replicate the average of three technical replicates. White bars in the histograms correspond to values from SARC1 and grey bars to values from SMARC1N-PN1. ANOVA P values ≤0.05 are marked with a black asterisk. A white asterisk indicates a P value of 0.06 for SIR and 0.08 for HMT. Abbreviations are as follows: ATPS, sulphate adenylyltransferase; APSR, adenylyl sulphate reductase; SIR, sulphite reductase; SERAT, Ser acetyltransferase; OASS, O-acetylserine sulphhydrylase; CGS, cystathionine γ-synthase; CBL, cystathionine β-lyase; HMT, homocysteine S-methyltransferase; MGL, Met γ-lyase; BCAT, branched chain amino acid aminotransferase; TAT, Tyr aminotransferase; SBP, selenium binding protein.

