FIGURE 1.
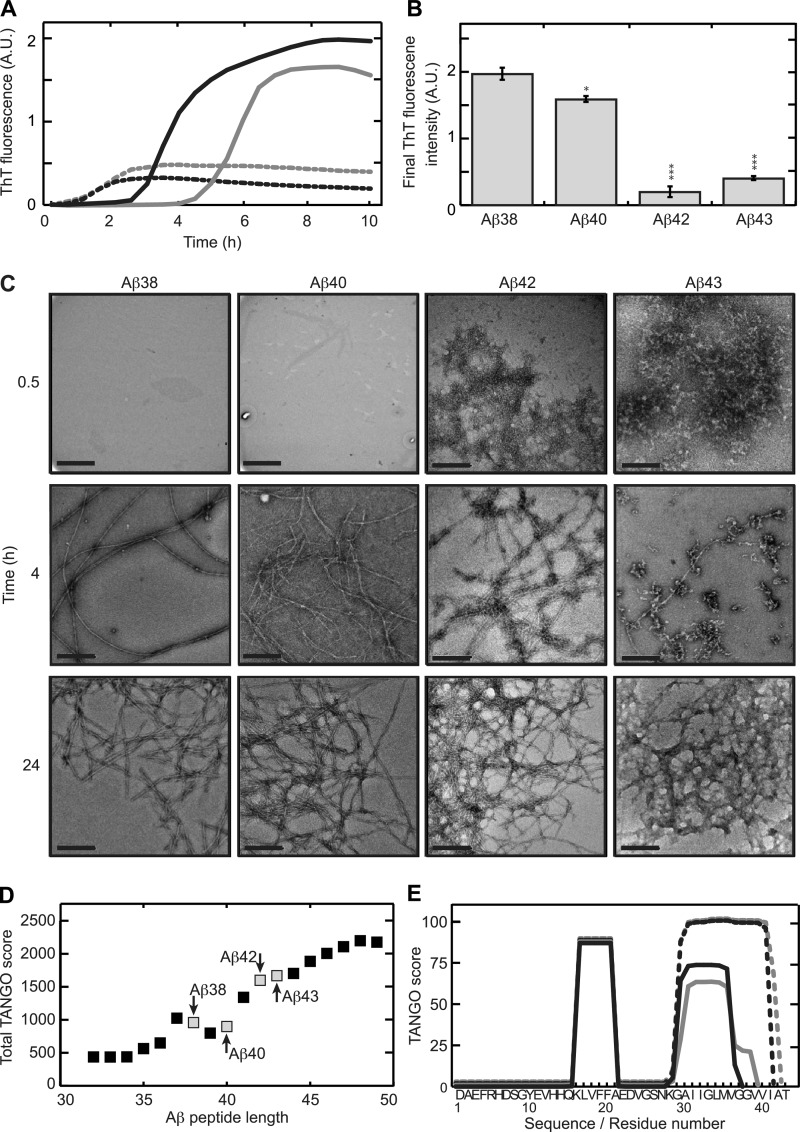
C-terminal heterogeneity affects aggregation kinetics of the Aβ peptide. A, ThT fluorescence was recorded in situ every 5 min at 25 °C. Aβ1–38 (continuous black line) and Aβ1–40 (continuous gray line) display a lag phase, whereas Aβ1–42 (dotted black line) and Aβ1–43 (dotted gray line) induce ThT fluorescence almost immediately. The values represent the means of three experiments. A.U., absorbance units. B, final (10 h) ThT fluorescence intensities was derived from panel A. Statistical significance (unpaired 2-tailed t test) compared with the Aβ1–38 value is indicated by *** (p < 0.0001), ** (p < 0.0005), or * (p < 0.005). C, after 0.5 h of incubation Aβ1–42 and Aβ1–43 formed networks, whereas Aβ1–38 and Aβ1–40 do not show visible aggregates. After 4 h of incubation, Aβ1–38 and Aβ1–40 formed 8–12-nm wide, extended, negatively stained fibrils. Aβ1–42 organized into a network of rigid 14–16-nm wide fibrils. For Aβ1–43, a mixture of protofibrils and fibrils was observed. After 24 h all Aβs formed similar fibrillar networks. Scale bar, 200 nm. D, total TANGO scores indicated an increasing overall aggregation propensity of Aβ with increasing peptide length. 37–40 amino acid-long peptides deviated from this trend. Peptides studied in this manuscript are marked. E, sequence-based prediction of aggregation prone stretches by the TANGO algorithm suggests a common aggregating region in the core of the peptide and a second aggregating region at the C terminus. Differences in total TANGO score (D) are exclusively due to the C-terminal aggregating region. Aβ1–38 (continuous black line) and Aβ1–40 (continuous gray line) display similar predicted aggregation propensity, whereas that of Aβ1–42 (dotted black line) and Aβ1–43 (dotted gray line) were higher.

