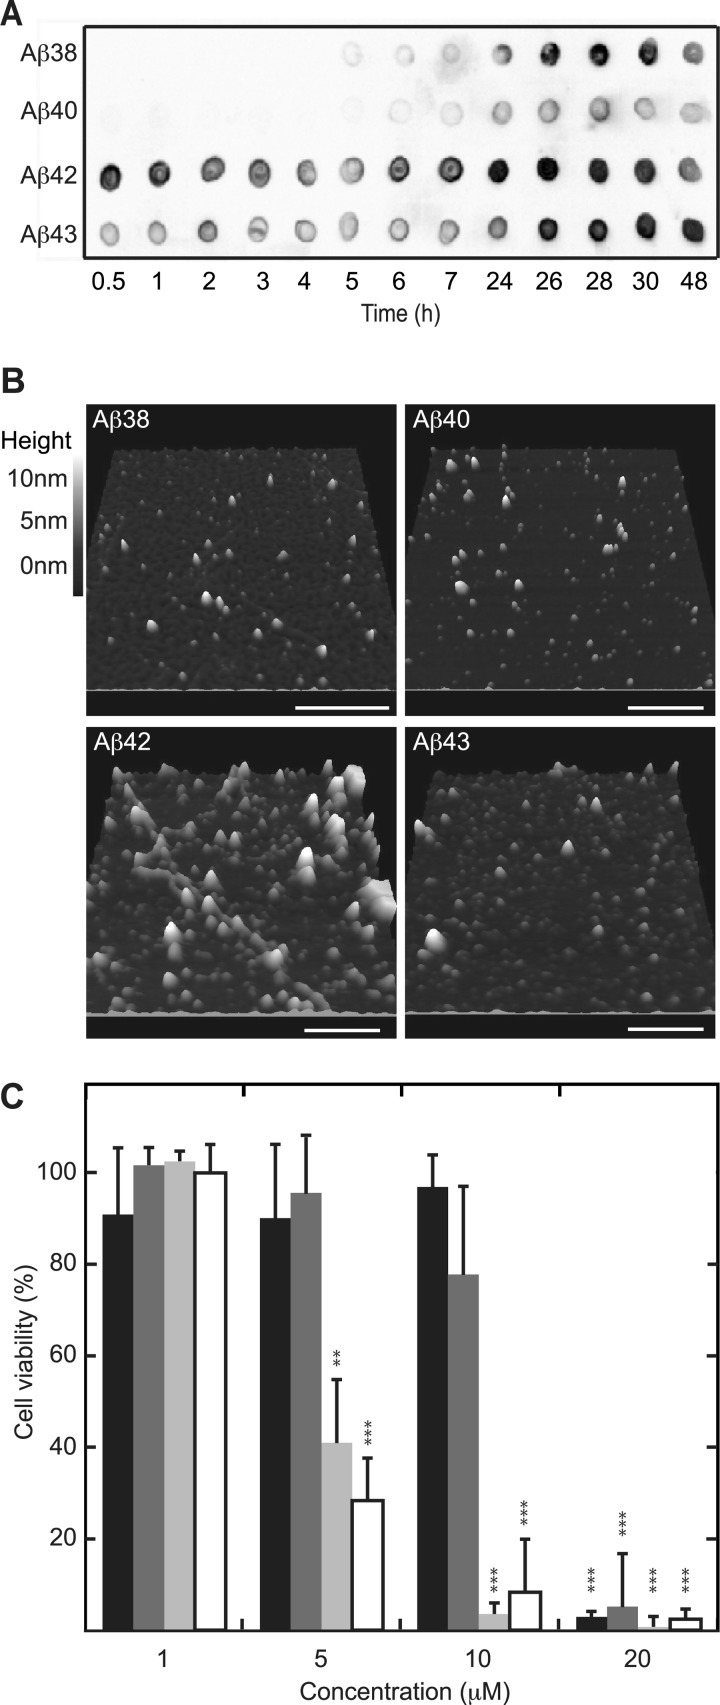
FIGURE 2.
Differences in aggregation kinetics due to C-terminal heterogeneity are reflected at toxic oligomer levels. Aβ at 50 μm was allowed to aggregate at 25 °C under quiescent conditions. A, analysis with the A11 oligomer-specific antibody detected oligomeric Aβ1–42 and Aβ1–43 after as little as 0.5 h of incubation, whereas Aβ1–38 and Aβ1–40 became A11-positive after 5–6 h of incubation. B, imaging using AFM indicated the presence of oligomers for all Aβ samples incubated for 1.5 h. The length of the bar represents 500 nm. C, preincubated (1.5 h) Aβ was added to cultured SH-SY5Y cells and incubated for 24 h before probing cytotoxicity using Cell Titer Blue viability assay. Aβ1–38 (black) and Aβ1–40 (dark gray) only cause cytotoxicity at a concentration of 20 μm, whereas Aβ1–42 (light gray) and Aβ1–43 (white) are significantly cytotoxic at a concentration of 5 μm. Values are expressed as the percent of cell viability ± S.D. (n = 4), and buffer signal was normalized to 100%. Statistical significance (unpaired 2-tailed t test) compared with buffer control values (normalized to 100%) is indicated by p value analysis similar to Fig. 1B.

