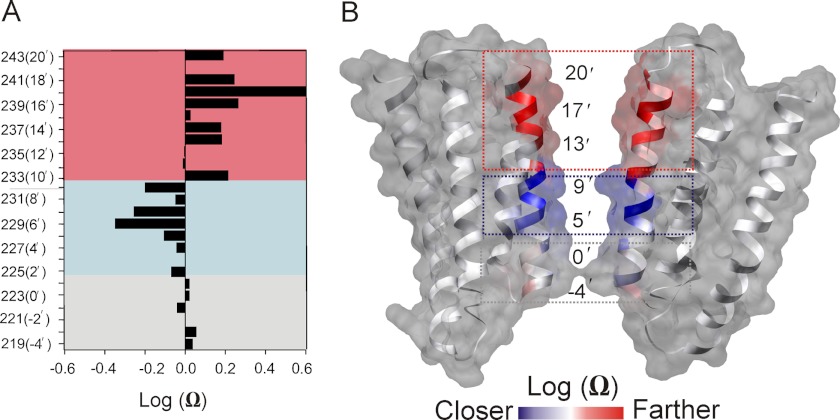
FIGURE 2.
Changes in the spin label proximity during gating. A, profile of changes in the amplitude of the EPR signal reflecting differences in the spin-spin dipolar coupling in the closed and desensitized conformation. For positions with log Ω < 0, the proximity between individual spin labels increases as the side chains get closer toward the pore axis and for log Ω > 0, the spin labels move away from the pore axis and further apart from each other. In each case, the same sample is used for both closed and desensitized state measurements. B, the log Ω parameter mapped on to the GLIC crystal structure. Residues displayed in red and blue show positive and negative log Ω values, respectively. Residues colored in white show values closer to 0. The boxed areas highlight regions moving away, getting closer and regions of no significant movement.

