FIGURE 3.
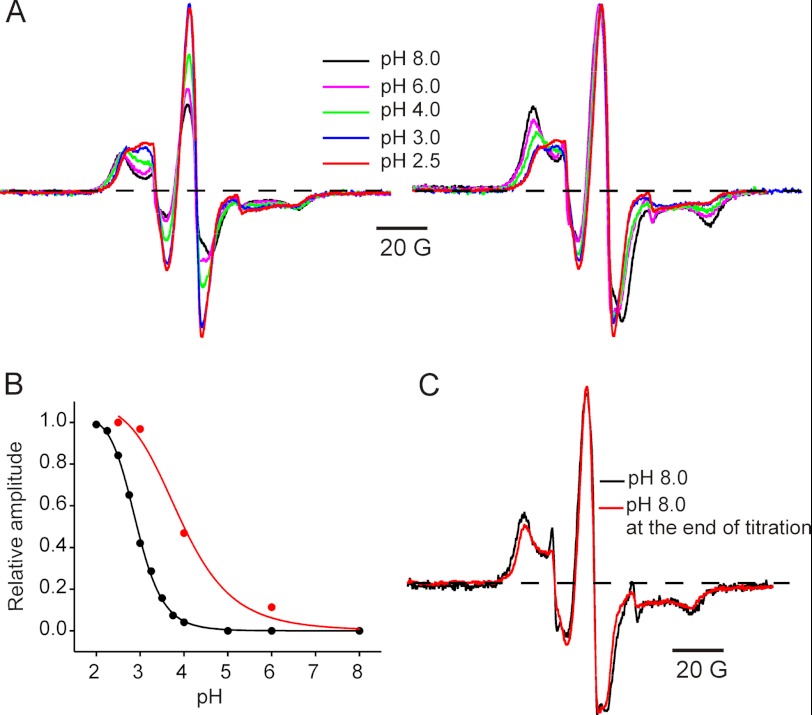
pH-dependent conformational changes at the activation gate monitored by position 240 movements. A, EPR line shapes obtained after sequentially equilibrating the sample with the indicated pH starting with pH 8.0. In each case, the spectra are normalized to the number of spin. B, pH dependence of EPR signal amplitude (red) overlaid with the pH dependence of the maximal peak response from macroscopic current measurements (black). The pKa of maximal response are 3.9 + 0.2 and 2.9 + 0.1 for the EPR and current measurements, respectively. C, samples were returned to pH 8.0 at the end of sequential pH change. Overlapping spectra shows reversibility of the spectral line shapes.

