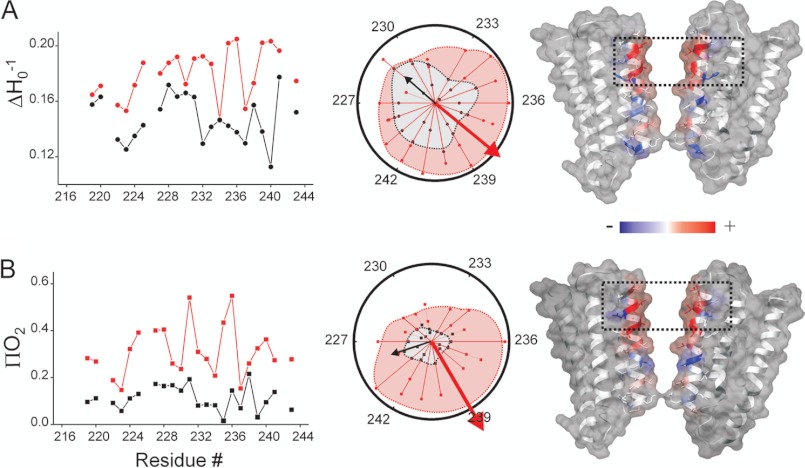
FIGURE 4.
Changes in the residue enviromental parameters. A, mobility ΔHo−1. B, O2 accessibility ΠO2 for the closed (black) and desensitized (red) states. Shown is the profile of changes in the enviromental parameters for the M2 residues (left). Shown is a helical wheel representation of the mobility and accessibility superimposed in a polar coordinate (middle). The resultant vector of the individual ΔHo−1 or ΠO2 values points toward the more mobile or solvent accessible face of the helix. The shaded area within the dashed lines highlights the projection for complete set of accessibility data relative to the maximal accessibility vector. Fractional differences (normalized to the maximum value measured within each data set) in the ΔHo−1 and ΠO2 values for the closed and desensitized states mapped on the GLIC structure and color coded, with red denoting an increase and blue representing a decrease in the environmental parameter (right).

