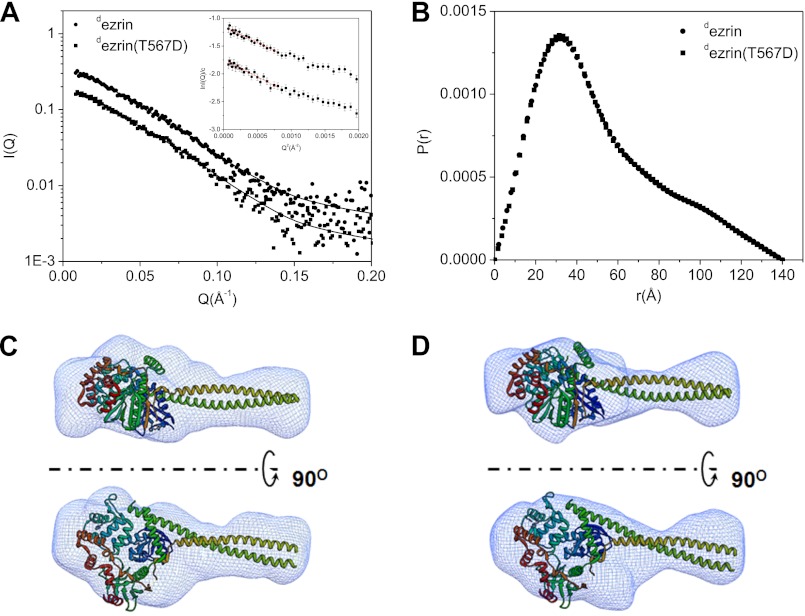
FIGURE 2.
Comparing the structures of ezrin and phospho-mimetic ezrin(T567D) in solution using SANS. A, SANS I(Q) of dezrin at 1.75 mg/ml and dezrin(T567D) at 1.57 mg/ml. I(Q) values are scaled to show the different scattering curves. The lines are fit to the experimental data when ab initio reconstructs the three-dimenional shapes shown in C and D. The χ2 values for the fit are 0.356 and 0.377 for dezrin and dezrin(T567D), respectively. The Guinier plots and fits are shown in the inset. B, P(r) functions of dezrin and dezrin(T567D). C and D, ab initio reconstructed three-dimenional envelopes of dezrin and dezrin(T567D) are docked with the crystal structure of Sfmoesin (Protein Data Bank code 2I1K). The models are generated by averaging 10 models generated by DAMMIN. The largest NSD value (57) with dezrin three-dimenional shape is 0.606 and 0.559 for dezrin(T567D).

