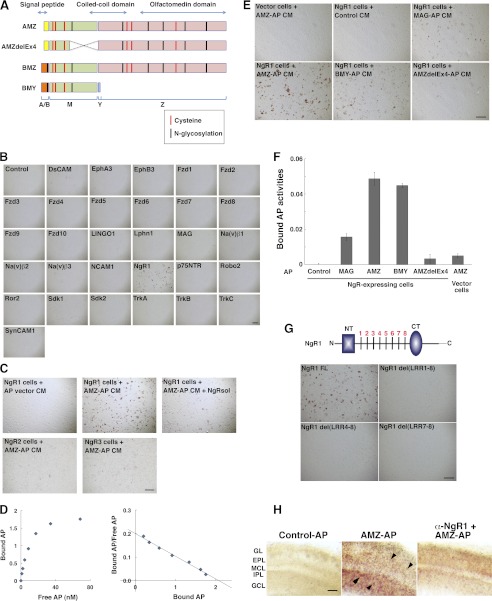
FIGURE 1.
Secreted Olfm1-AP binds to NgR1 on the surface of COS7 cells. A, schematic diagram showing three different isoforms (AMZ, BMZ, and BMY), and a deletion mutant (AMZdelEx4) of the Olfm1 protein, their domain structures, and possible modification sites. The alternative N-terminal sequences, A and B, that include signal peptides are shown in yellow and orange, the central M part of Olfm1 is common for all isoforms and is shown in green. The olfactomedin domain is marked in pink. B, Olfm1-AP binds to NgR1 but not to other tested receptor and membrane proteins on the surface of COS7 cells. COS7 cells transfected with receptor-expressing constructs are indicated in each panel. Two days later, cells were incubated with 10 nm Olfm1 (AMZ)-AP and stained for bound AP. Scale bar = 500 μm. C, Olfm1 (AMZ)-AP (10 nm) binds to NgR1 more strongly than to NgR2 or NgR3, and this binding was inhibited by soluble NgR1 protein (NgRsol) (5 nm). Scale bar = 500 μm. D, Scatchard plot of Olfm1 (AMZ)-AP binding to NgR1. These experiments were repeated four times, and results of typical experiment are shown. E, binding of different isoforms of Olfm1-AP, a deletion mutant of Olfm1-AP and MAG-AP, to COS7 cells transfected with NgR1. The AP activities in all CM were adjusted to the same concentration before adding to the NgR1 cells. Note that mutated Olfm1 with a deletion in the central region (delEx4) exhibits reduced activity. Scale bar = 500 μm. F, quantification of the results shown in E. G, binding of Olfm1-AP to COS7 cells transfected with full-length and deletion mutants of NgR1. The schematic diagram shows the main structural features of the NgR1 protein. The N- and C-terminal cysteine-rich cupping domains are shown as a blue rectangle and oval, respectively. Eight leucine-rich repeats are marked by transverse black lines. NT, N-terminal capping domain; CT, C-terminal capping domain. Scale bar = 500 μm. H, binding of Olfm1-AP to the sections from mouse P3 olfactory bulbs. Fresh sections (200 μm) were incubated with AP (left panel) or Olfm1-AP (center and right panels) together with normal rabbit IgG (left and center panels) or anti-NgR1 polyclonal IgG (right panel) at the concentration of 5 ng IgG/μl. The arrowheads show positive cells in different cell layers. EPL, external plexiform layer; GCL, granule cell layer; GL, glomerular layer; IPL, internal plexiform layer; MCL, mitral cell layer. Scale bar = 100 μm.

