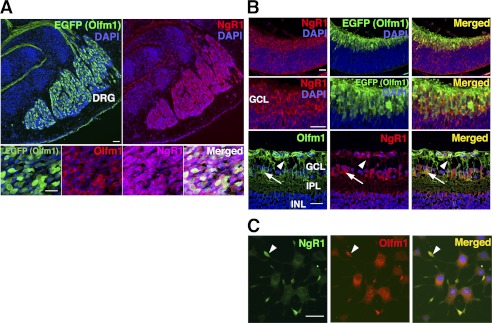
FIGURE 4.
Colocalization of Olfm1 and NgR1 in mouse tissues and PC12 cells. A, DRG from E13.5 TG(Olfm1:EGFP) mice was stained with indicated antibodies. Upper panels, green, EGFP; red, NgR1. Lower panels, green, EGFP; red, Olfm1; purple, NgR1. Nuclei were stained with DAPI (blue). Note that only about 30% of NgR1-expressing cells were EGFP- and Olfm1-positive. Scale bar = 25 μm. B, retina from E13.5 (upper and center panels) and P3 (lower panels) TG(Olfm1:EGFP) mice stained for Olfm1 and NgR1. Colocalization of Olfm1 and NgR1 is observed in cell soma (arrows) and neurites (arrowheads). GCL, ganglion cell layer; INL, inner nuclear layer; IPL, inner plexiform layer. Scale bar = 25 μm. C, PC12 cells stained for Olfm1 (red) and NgR1 (green). Both Olfm1 and NgR1 accumulate in growth cones (arrowheads). Scale bars = 25 μm.

