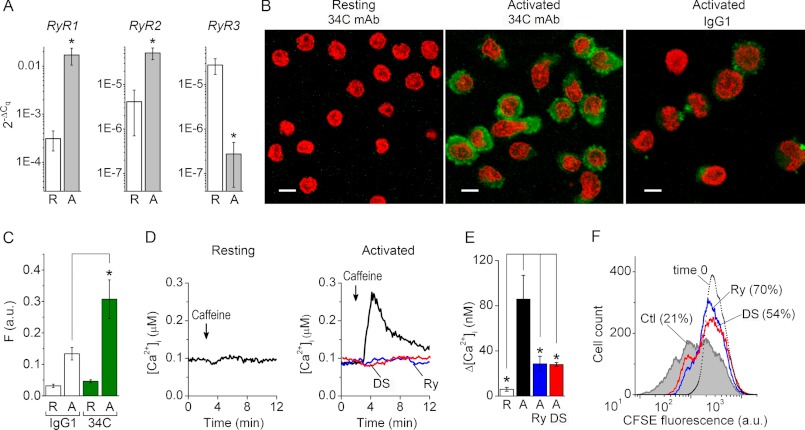
FIGURE 1.
RyR gene expression and function are up-regulated after T cell activation. A, average normalized linearized RyR1 (left), RyR2 (middle), and RyR3 (right) Cq values in resting T cells (R; n = 9) and 5-day activated (A; n = 7) primary human T cells. B, anti-RyR immunoreactivity (green) revealed with 34C primary mAb in resting (left) and 5-day activated (middle) T cells. Right, nonspecific staining of 5-day activated T cells produced by mouse IgG1 mAb (negative control). Scale bars, 5 μm. Optical slice depth < 4.5 μm. C, average levels of nonspecific background staining produced by IgG1 mAb (open bars) and RyR1/2 immunoreactivity detected with 34C mAb (green bars) in resting (R) and activated (A) T cells (n = 8). Before averaging, fluorescence intensities (F) were determined from confocal images recorded in the green channel as those shown in B and normalized to the number of cells in each image. a.u., arbitrary units. D, [Ca2+]i responses to caffeine (recorded from resting (left) and 5-day activated (right) T cells preincubated with vehicle (black trace), Ry (blue trace), or DS (red trace). Caffeine was applied as indicated. E, average caffeine-induced [Ca2+]i transients recorded from resting T cells (R, open bar; n = 4), control 5-day activated T cells pretreated with vehicle alone (Ctl; black bar; n = 7), and activated T cells pretreated with Ry (Ry; blue bar; n = 7) or DS (DS, red bar; n = 5). Levels of [Ca2+]i prior to caffeine application were subtracted before averaging. F, fluorescence profile of CFSE-loaded human T cells activated for 4 days in the presence of vehicle alone (Ctl, gray-filled histogram), Ry (Ry, histogram outlined by a blue line), or DS (DS, histogram outlined by a red line). The histogram outlined with dots represents the fluorescence profiles of CFSE-loaded resting T cells prior to activation (undivided cell population at time 0). The numbers in parentheses indicate a percentage of undivided cells in each group. Histogram peaks represent successive generations. Results shown are representative data from three experiments. * (in all panels), differences between means are significant (p < 0.01). Error bars, S.E.

