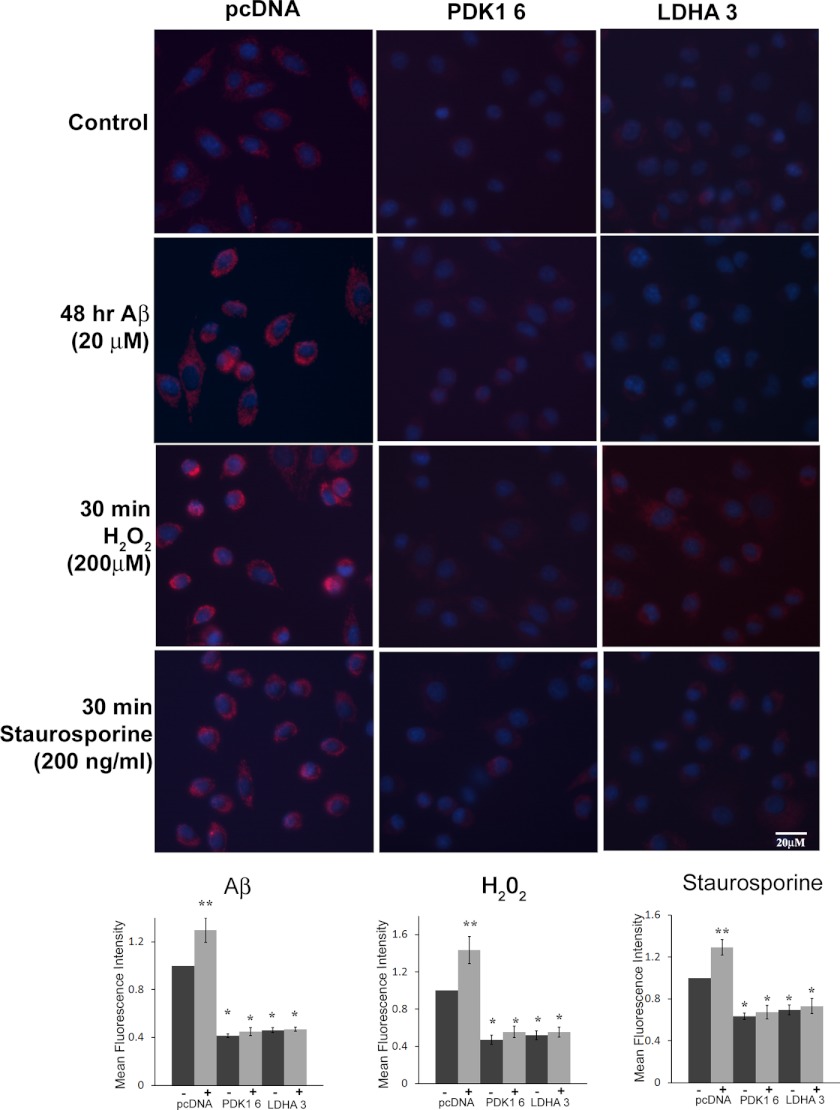
FIGURE 4.
Decreased mitochondrial ROS in LDHA- and PDK 1-overexpressing cells. Top panels, mitochondrial ROS production was measured in B12 cell lines following labeling with the red fluorescent dye MitoTracker-ROS Red (MTR). B12 clonal cell lines overexpressing PDK1 or LDHA exhibited a significant reduction in mitochondrial ROS (red) compared with the parental (pcDNA) cell line expressing the empty vector under both normal culture conditions and following exposure to Aβ(25–35)(20 μm), H2O2 (200 μm), or staurosporine (200 ng/ml) for the indicated time periods. Nuclei were stained with Hoescht (blue) and visualized by fluorescence microscopy at ×400 magnification. Bottom panels, quantification of MTR fluorescent images revealed that mitochondrial ROS production was significantly decreased in PDK1- or LDHA-overexpressing cell lines compared with the pcDNA control line (*, p < 0.05; **, p < 0.01). Data presented are the average of three independent experiments.

