FIGURE 4.
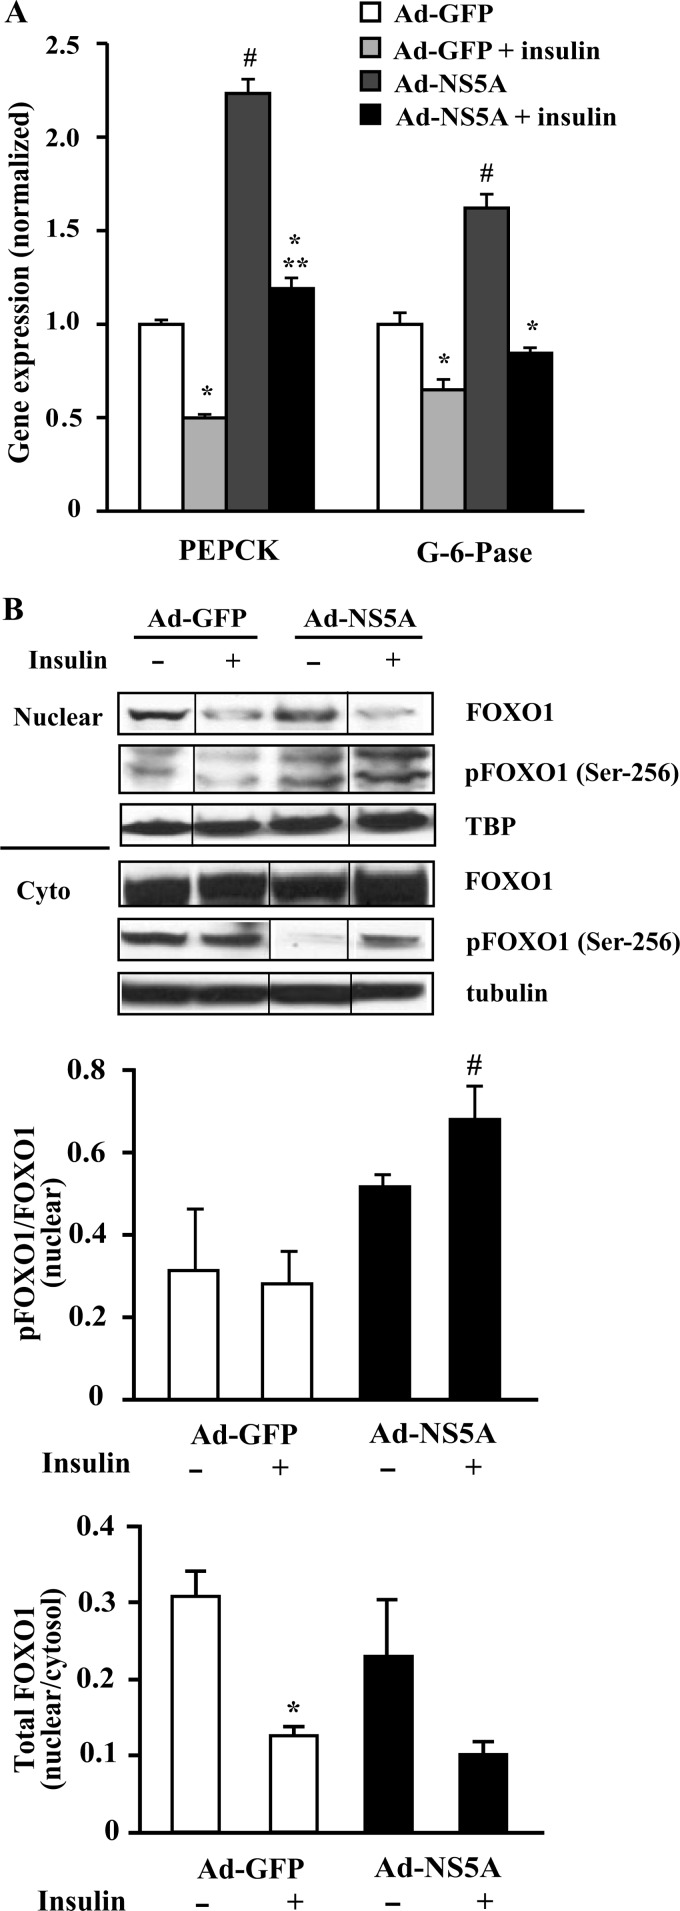
Insulin action on PEPCK, G-6-Pase, and pFOXO1 expression in NS5A-overexpressed HepG2 cells. HepG2 cells were infected with either Ad-GFP or Ad-NS5A and treated with or without 100 nm insulin for 6 h. A, PEPCK and G-6-Pase RNA levels were measured by qPCR. The values are presented as the means ± S.E. *, p < 0.05 versus no insulin; #, p < 0.005 versus Ad-GFP; **, p < 0.02 versus Ad-GFP + insulin (n = 3). B, equal amounts of nuclear/cytoplasmic (Cyto) extracts were collected from the similar treatment and subjected to Western blot analysis with pFOXO1 (Ser-256), total FOXO1, and TATA binding protein (TBP) or tubulin as a loading control. The representative blot is a composite of a larger blot in which all the samples were run simultaneously together, and the composite was made by splicing complete lanes together for presentation purposes. Quantification by densitometry was expressed as ratio of nuclear pFOXO1 (Ser-256) to total FOXO1 and nuclear to cytoplasmic total FOXO1. The values are presented as the means ± S.E. (n = 3). #, p < 0.05 versus Ad-NS5A control; *, p < 0.05 versus Ad-GFP control.

