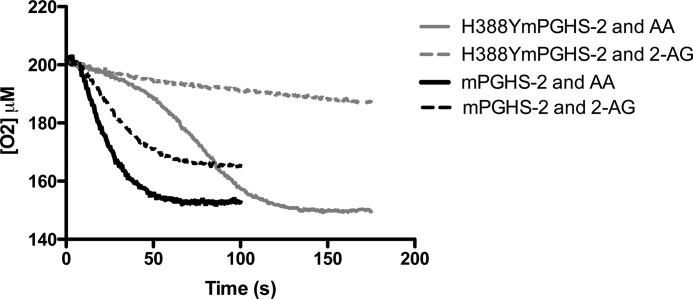
FIGURE 5.
Oxygenation of AA and 2-AG by H388Y mPGHS-2. 400 nm WT mPGHS2 was incubated with a 50 μm concentration of either AA (solid line) or 2-AG (broken line), in standard assay buffer, as described under “Experimental Procedures.” For comparison, H388Y mPGHS2 was incubated with a 50 μm concentration of either AA (solid line) or 2-AG (broken line), in standard assay buffer as described under “Experimental Procedures.” Traces are representative of triplicate determinations. In a single experiment, the end point values for each curve varied by no more than 5%.

