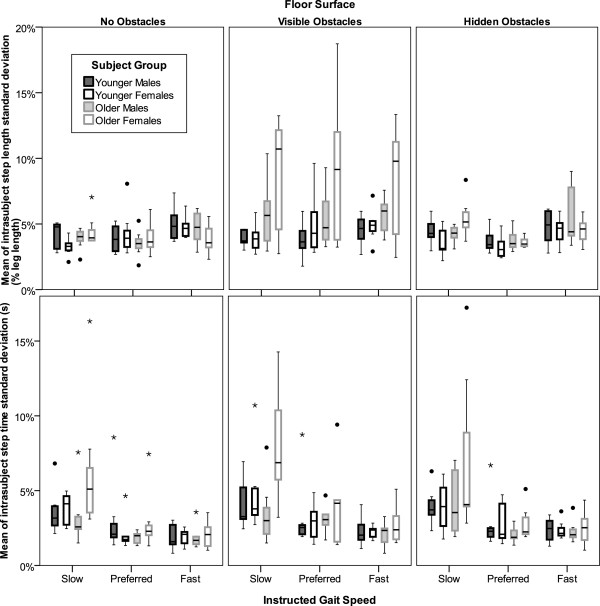
Figure 4.
Error bar plots of step length and time variability by subject group, flooring condition, and speed. Step length and time variability were greater on surfaces with obstacles, but these effects (p=0.007 and 0.02, respectively) did not reach the threshold of significance (p<0.0031) when data were coded for all three surface conditions. However, when the data were recoded to test for the presence or absence of obstacles (no obstacles=0 and visible or hidden obstacles=1) and for the effects of obstacle visibility (visible obstacles=1 and both other conditions=0), then step length variability was significantly (p<0.0019) increased by obstacle visibility while the presence of obstacles (whether they were visible or not) had a greater effect on step time variability (p=0.009) than obstacle visibility (p=0.05). This effect on step time variability was most extreme for gait at slower instructed speeds (bottom row).

