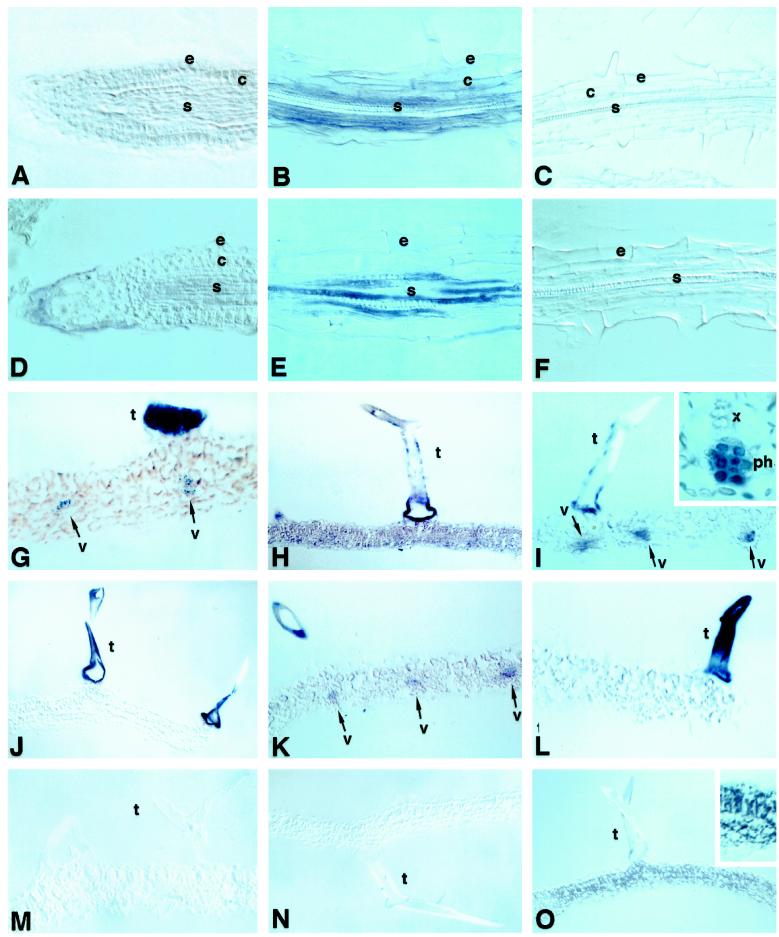
Figure 1.
Expression of MT1a and MT2a in Arabidopsis roots and leaves. The hybridization signal ranged from purple to dark blue. A, B, G, H, and I, Sections probed with MT1a antisense; C and M, sections probed with MT1a sense; D, E, J, K, and L, sections probed with MT2a antisense; F and N, sections probed with antisense probe with MT2a sense; O, section probed with antisense probe for the chloroplast-specific transcript psbO. All roots sections are from 6-d-old seedlings grown without excess copper. A and D, Longitudinal sections. A and D, Root-tip sections. B, C, E, and F correspond to sections through the maturation region. All leaf sections are from the youngest leaves of 2-week-old untreated plants (G, J, M, and O) or plants treated with excess copper (H, I, K, and L). Inset in I corresponds to a higher magnification of one of the vascular bundles. e, Epidermis; c, cortex; s, stele; t, trichome; v, vascular bundle. Arrows, Locations of hybridization signal.

