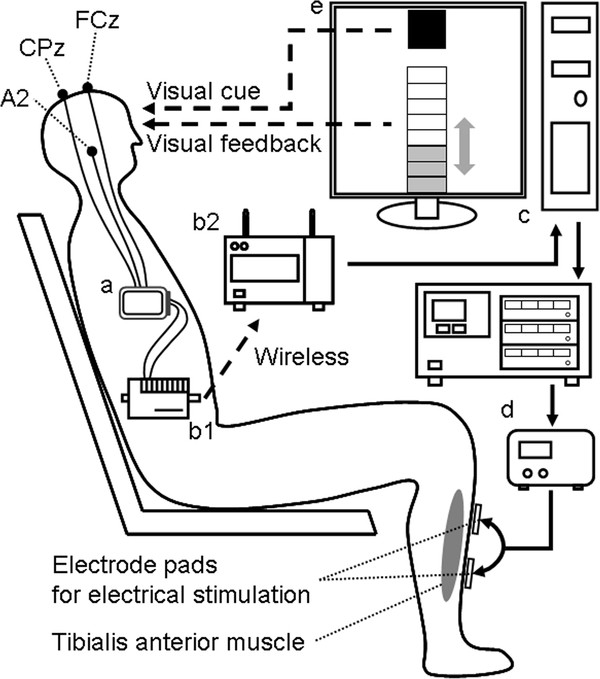
Figure 1.

Schematic of the experimental system.a: Active electrode system, 3 filled circles: positions of EEG electrodes. b: Wireless multi-telemeter system, b1: sender, b2: receiver. c: Computer with A/D-D/A converter. d: Electrical stimulator and isolator for FES. e: The filled square presented as a cue during the task period. The 8-steps bar height denoted the FES amplitude intensity.
