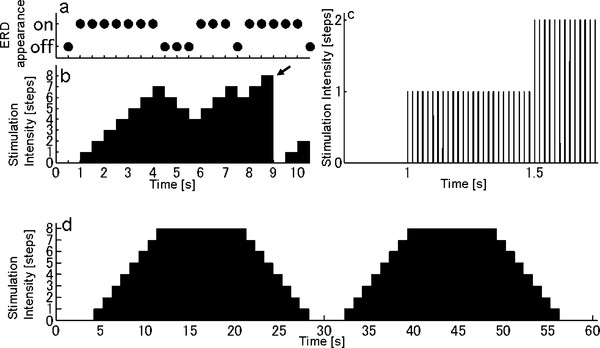
Figure 2.

Temporal sequence of ERD.a: An example of ERD appearance. The ERD appearance was determined every 500 ms in the intervention experiment. b: An example of stimulation sequence in the intervention experiment, which is modulated by ERD appearance shown in (a). The amplitude of stimulation intensity changed dependent on the ERD appearance. When the amplitude reached the maximum step, the current was returned to zero (arrow). c: An enlarged view of (b). The amplitude of current pulse train (50 Hz rectangle pulses; 1.2 ms width) was modulated. d: For FES training without ERD (control experiment), the stimulation sequence consisting of two trapezoidal forms was used.
