
Figure 3.
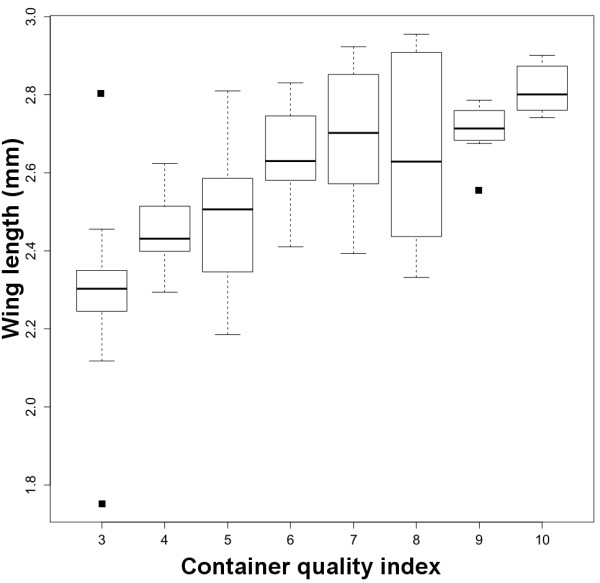
Association between wing length and the container quality index. Boxplot indicating median (horizontal line), interquartile (box) and range (dotted lines). Dots represent outlier observations.
Official websites use .gov
A
.gov website belongs to an official
government organization in the United States.
Secure .gov websites use HTTPS
A lock (
) or https:// means you've safely
connected to the .gov website. Share sensitive
information only on official, secure websites.
Association between wing length and the container quality index. Boxplot indicating median (horizontal line), interquartile (box) and range (dotted lines). Dots represent outlier observations.