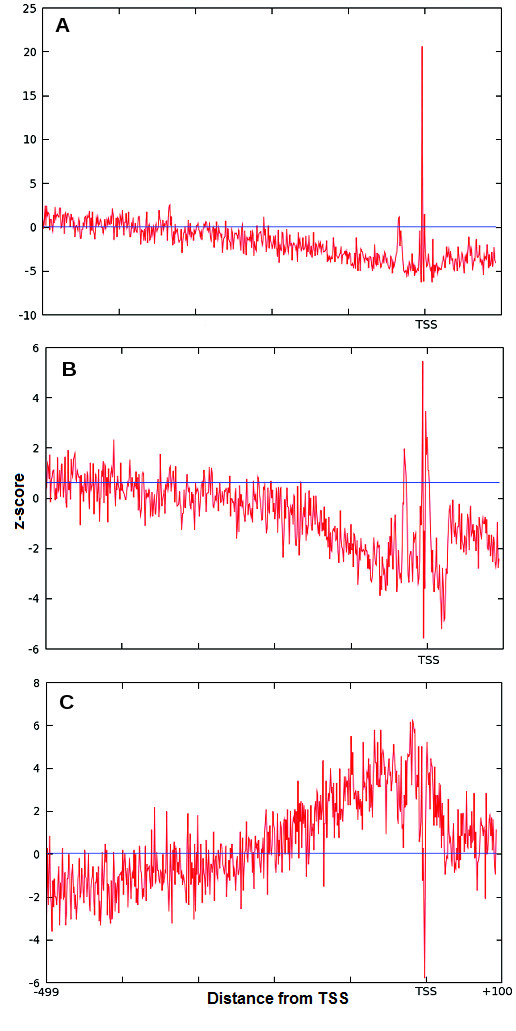
Figure 2.

Distribution of the occurrence frequency of TCF-1, Ets-1 and E2F in human promoter database (EPD) in the proximal promoter region. The individual occurrence frequency distributions of the various transcription factors in human promoters from EPD. The y-axis is the OF of the transcription factors TCF-1 (A), Ets-1 (B) and E2F (C) motifs. The x-axis shows the areas upstream and downstream of the TSS which is at 0. The blue horizontal line shows the expected occurrence frequency OFr for each of the factors calculated from the shuffled sequence dataset.
