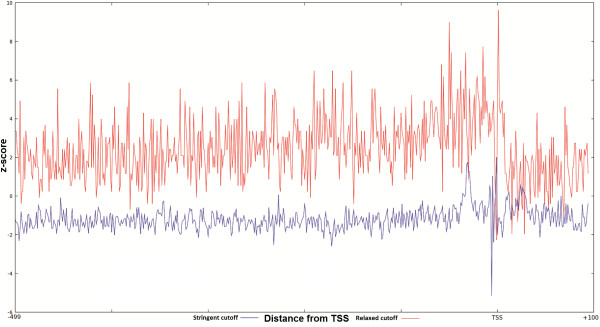
Figure 4.
z-score distribution for Pu1 transcription factor across the promoter sequences from EPD (-499 to +100). Blue plot is the distribution of z-score with relaxed threshold and red is with stringent threshold. X-axis represents distance with regards to TSS(bp) and y-axis represents the z-score.

