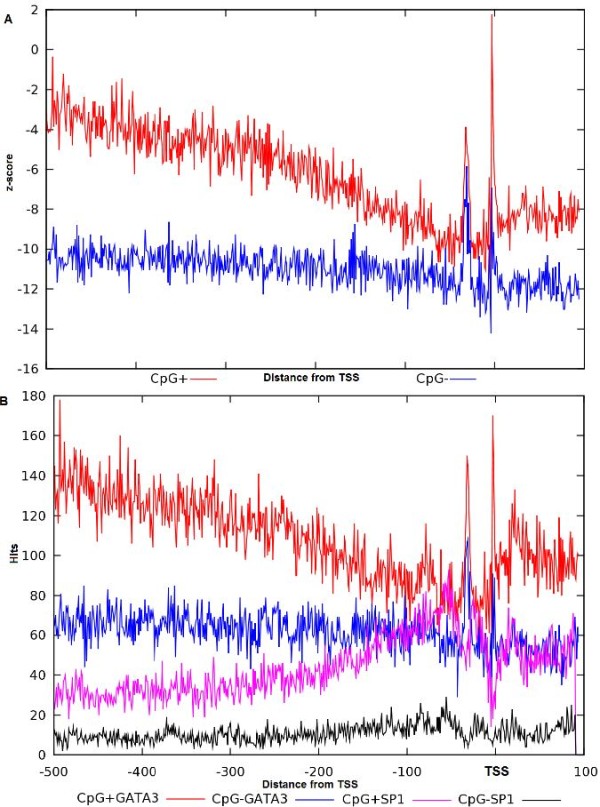
Figure 6.

Comparison of the GATA-3 z-score distribution in promoters divided with respect to the presence of CpG islands. Distribution of the GATA-3 and Sp1 motif across the EPD promoters divided based on the presence and absence of CpG-island. A) Comparison of the distribution of GATA-3 in promoters containing CpG-island (red plot) and promoters lacking CpG-island (blue plot). X-axis represents distance (bp) with regards to TSS and y-axis represents the z-score. B) Comparison of the distribution of hits of GATA-3 and Sp1. GATA-3 hits are represented with red and blue in CpG-island present and absent promoters respectively and magenta and black represent the distribution in CpG-island present and absent promoters respectively. X-axis represents distance (bp) with regards to TSS and y-axis represents the hits.
