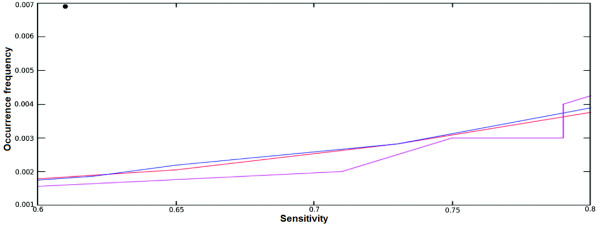
Figure 7.
Comparison of PWM (mono-nucleotide and di-nucleotide) with the program Match. The OFr and sensitivity comparison for different PWM and Match. Occurrence frequencies are at Y-axis. X-axis denotes the sensitivities. The average OFr of the Match tool is denoted as filled circle (upper left corner). The sensitivity and specificity curve for the PWM obtained from GATA-3 binding sites from Jaspar is represented by blue, red and magenta are of the new mono-nucleotide PWM and di-nucleotide PWM respectively.

