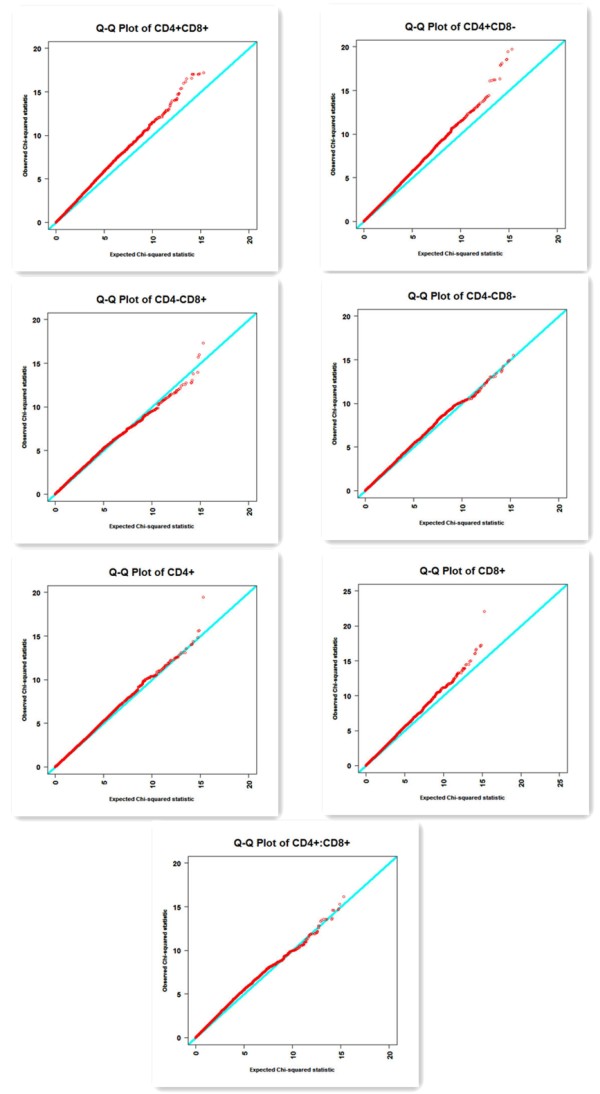
Figure 1 .
Quantile-quantile (Q-Q) plots of test statistics in GWA for T-cell subpopulations. Under the null hypothesis of no association at any SNP locus, the points would be expected to follow the slope lines. Deviations from the slope lines correspond to loci that deviate from the null hypotheses.

