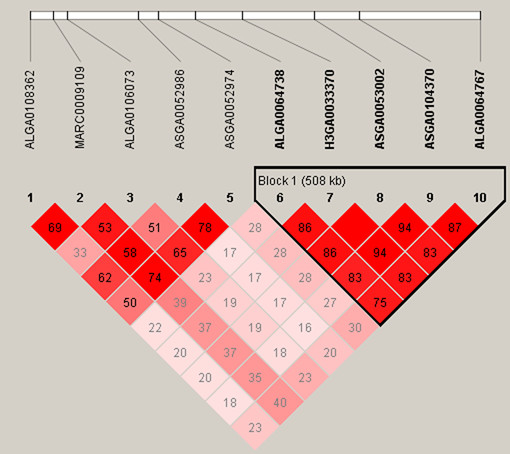
Figure 2 .

Linkage disequilibrium (LD) pattern for significant SNPs on SSC12. LD blocks are marked with triangles. Values in boxes are LD (r²) between SNP pairs and the boxes are coloured according to the standard Haploview colour scheme: LOD > 2 and D' = 1, red; LOD > 2 and D' < 1, shades of pink/red; LOD < 2 and D' = 1, blue; LOD < 2 and D' < 1, white (LOD is the log of the likelihood odds ratio, a measure of confidence in the value of D'.
