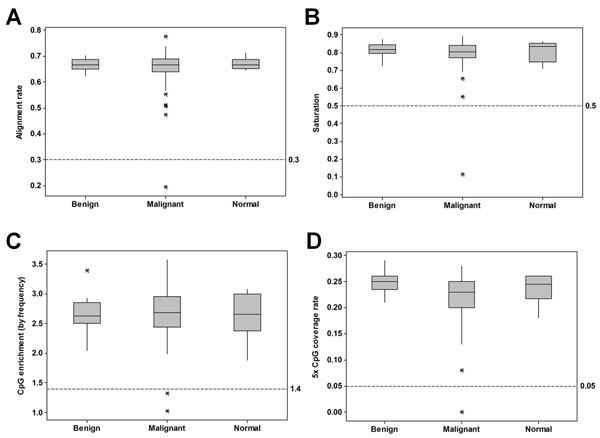
Figure 3.
QC analysis of a large sample cohort. The QC values associated with a large ovarian cancer study dataset are presented in box plots according to sample type (normal = 6, benign = 20, malignant = 71). In each plot, threshold cutoff values for sample exclusion are indicated by hatched horizontal reference lines. A, Box plot of MethylCap-seq unique read alignment rate. The fraction of pass-filter reads which align uniquely to the human reference genome. B, Box plot of Saturation analysis, a Pearson correlation coefficient estimation of sequencing library complexity and potential reproducibility. C, Box plot of CpG enrichment, the relative CpG dinucleotide frequency interrogated by aligned sequence reads divided by the relative frequency of CpG dinucleotides in the reference genome. D, Box plot of CpG coverage rate (5×), the fraction of CpG dinucleotides in the reference genome sequenced at least five times.

