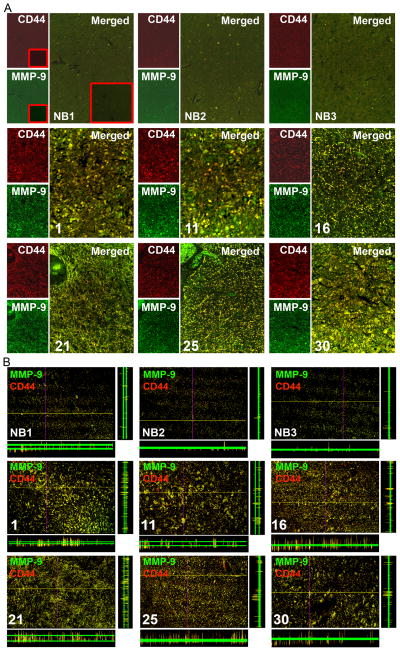
Figure 2. Human GBM express high levels of CD44 and MMP-9.
(A) Immunofluorescent microscopy was carried out for CD44 (red) and MMP-9 (green) using specific antibodies in tissues (from the Microarray mentioned in Figure 1) (Micrographs 20X). (Inset: negative control). (B) Confocal images were captured at identical locations (shown in Figure 2A). Red: CD44; Green: MMP-9; yellow: co-localization of CD44 and MMP-9 (Micrographs 20X). Z-slices were also shown. NB1, NB2 and NB3 are normal brain tissues. Samples 1, 11, 16, 21, 25 and 30 are shown (as shown in fig. 1).

