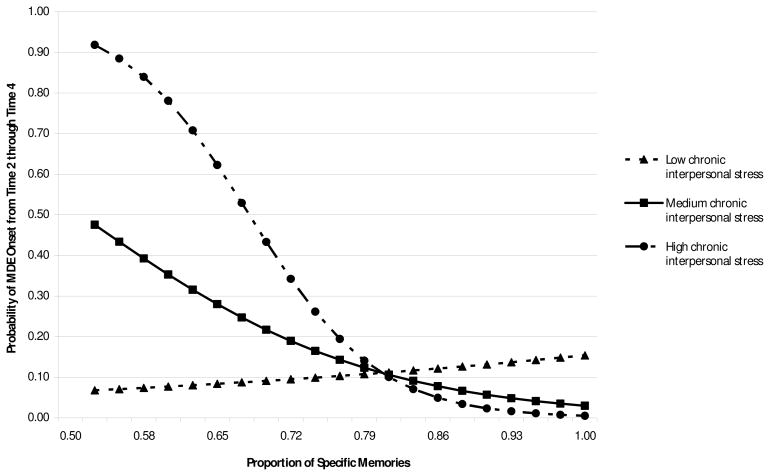
Figure 2.
Probability of MDE onset from Time 2 through Time 4 as a function of specific memories and chronic interpersonal stress. Values on the x-axis reflect the range of the proportion of specific memories in this sample. Low and high chronic interpersonal stress represent values of one standard deviation below and above the mean on this variable, respectively, and medium chronic interpersonal stress represents the mean value.

