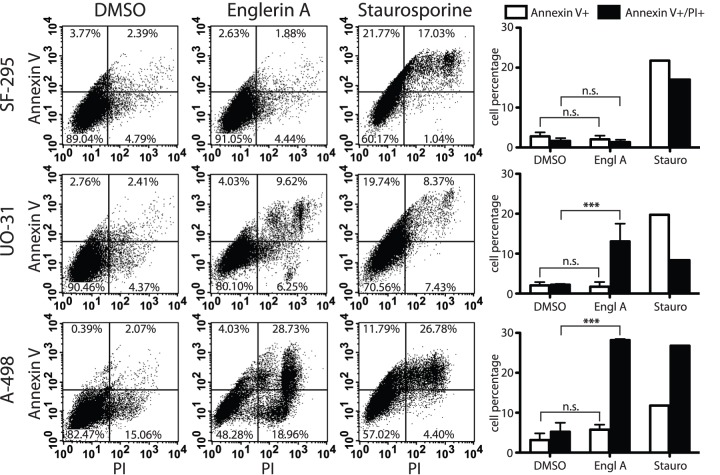
Figure 3. Englerin A does not lead to up-regulation of extracellular phosphatidyl serine.
Cells were treated with either 1 μM englerin A or carrier DMSO for 60 min, or 5 μM staurosporine for 3 h. After incubation, cells were trypsinized and stained for extracellular phosphatidyl serine expression using FITC-tagged Annexin V and propidium iodide (PI) as co-stain to test cell membrane integrity. Shown is a result representative of three independent experimental repeats. Quantifications and statistics of all data are depicted as bar graphs and show the distribution of cells testing positive for Annexin V binding (early apoptotic stages) or Annexin V binding and propidium iodide uptake (late apoptotic stages/necrotic death). Values shown are mean ± SEM (n = 3), statistically significant differences are marked with asterisks (*** p<0.001), n.s. = not significant.

