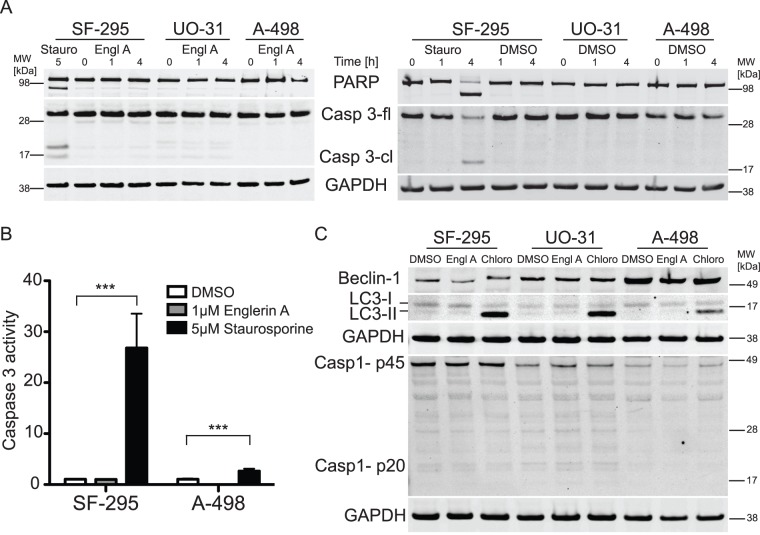
Figure 4. Englerin A does not induce cleavage of caspase 3, PARP, caspase 1 or the autophagic markers LC-3 and Beclin-1.
Cells were treated with either 1 μM englerin A, carrier DMSO or 5 μM staurosporine for the indicated amount of time. (A) After the incubation, cells were lysed and lysates were analyzed by immunoblotting for PARP cleavage or full-length and cleaved caspase 3 (Casp3-fl, Casp3-cl). Equal protein loading was confirmed by probing for GAPDH. Full-length and cleaved bands are indicated. The experiment was repeated three times. (B) Alternatively, after incubation cells were lysed and caspase 3 activity was tested using a caspase 3 activity assay kit. Values shown are means ± SEM (n = 6), statistically significant differences are marked with asterisks (*** p<0.001). (C) Cells were treated with either 1 μM englerin A, carrier DMSO for 60min or 50 μM chloroquine diphosphate (Chloro) for 18 h. After the incubation, cells were lysed and lysates were analyzed by immunoblotting for Beclin-1, LC3-I/II and caspase 1 cleavage (proenzyme p45 and cleaved active subunit p20). Equal protein loading was confirmed by probing for GAPDH. All membranes were analyzed using IRDye secondary antibodies and a Licor Odyssey system. Membranes shown are from representative experiments.

