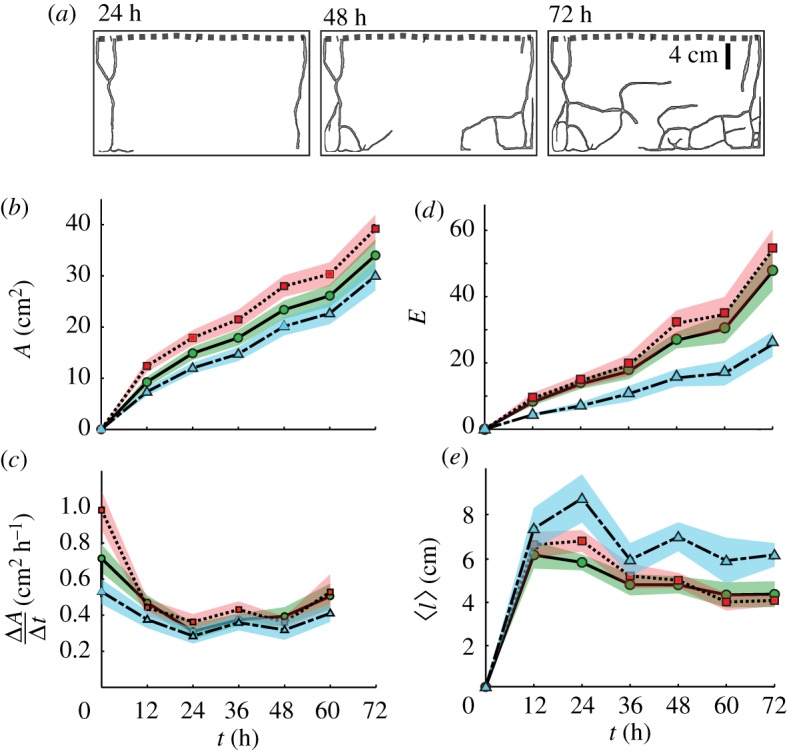
Figure 3.

Digging dynamics of S. invicta worker groups in quasi-two-dimensional arenas. (a) Image masks showing tunnel network growth as a function of time. (b) Tunnel area (A) versus time for small, control and large ants (solid line, dashed line and dot–dash line, respectively). Shaded areas are ± s.e. (c) Digging rate (ΔA/Δt) versus time. (d) The number of edges (E) in the tunnel network increased in time. (e) The mean path length, 〈l〉, between vertices in the network decreased in time after 12 h. (Online version in colour.)
