
Figure 4.
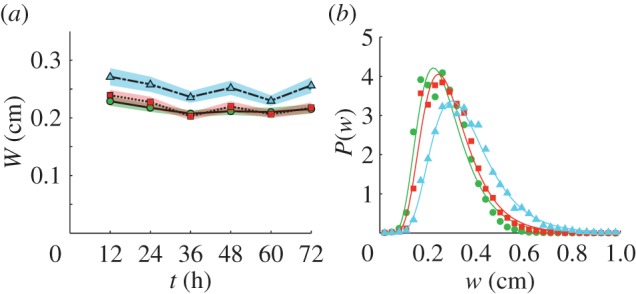
Tunnel width. (a) The mean width, W, of the tunnels versus time for small, control and large ants (solid line, dashed line and dot–dash line, respectively). Shaded areas are ± s.e. (b) The probability distribution of local tunnel width, P(w), is fitted by a lognormal function (described in the text) with parameters given in table 1. (Online version in colour.)