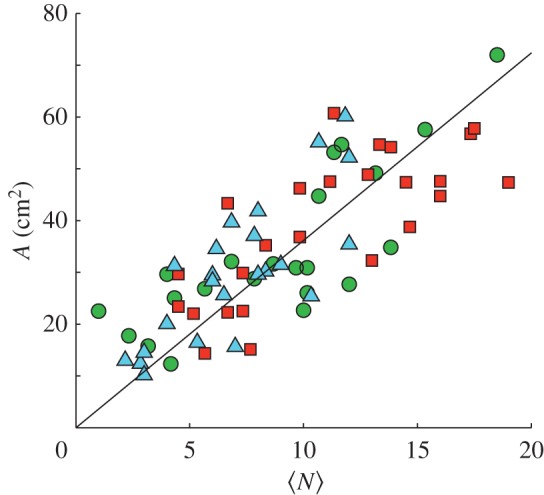
Figure 7.

Tunnel area versus subsurface workers. Tunnel area (A) after 72 h was positively correlated with the time average number of ants 〈N〉 found subsurface over the same period (A = α〈N〉; α = 3.62). The slope, α, did not differ among the three treatments. Small, control and large treatments are represented by the green circles, red squares and blue triangles, respectively. (Online version in colour.)
