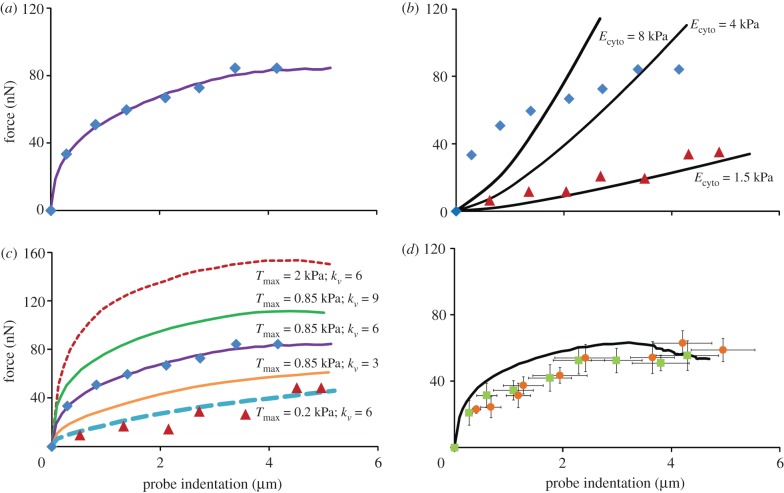
Figure 6.
(a) Computational probe force–indentation curves for the active model (solid line; Ecyto = 1.5 kPa, Tmax = 0.85 kPa,  ); mean experimental untreated cell (diamonds, n = 8) data included for comparison. (b) Computational probe–force indentation curves assuming a passive hyperelastic (solid line) cell cytoplasm. Predictions are shown for three values of cytoplasm stiffness: 1.5, 4 and 8 kPa. (c) Parametric study of the effect of active parameters Tmax and
  on predicted probe force–indentation curves (with Ecyto = 1.5 kPa). Diamonds, untreated cells (n = 8); triangles, cyto-D cells (n = 8). (d) Computational probe force–indentation curve for the active model with reduced cytoplasm stiffness (solid line; Ecyto = 0.03 kPa, Tmax = 0.85 kPa,
  ), and experimental probe force–indentation data (mean ± s.d.) for acrylamide (squares, n = 8) and colchicine (circles, n = 8) treated cells. (Online version in colour.)

