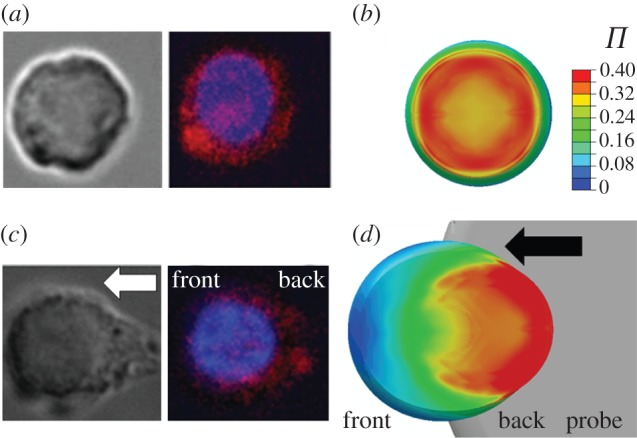
Figure 7.

(a) Representative brightfield and fluorescent image (bottom-up view) of a cell before shear deformation, with nuclei (blue) and actin (red) shown at a focal plane near the base. (b) Predicted distribution of the actin cytoskeleton before shear deformation for the active model (Ecyto = 1.5 kPa, Tmax = 0.85 kPa,  ). (c) Representative brightfield and fluorescent image (bottom-up view) of a cell after shear deformation. (d) Predicted distribution of the actin cytoskeleton following 10.9 µm of probe indentation. The arrow indicates the direction of probe movement.
