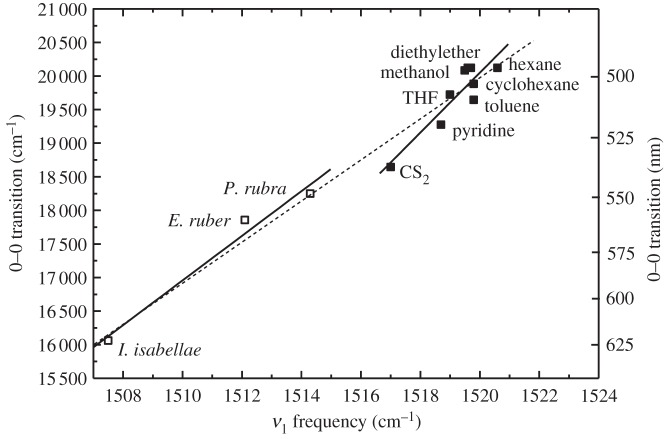
Figure 8.
Correlation between the position of the (0–0) spectral origin of the S0 → S2 transition and the ν1 rR band of canthaxanthin in different solvents (solid squares) and in the feathers (open squares) of P. rubra, E. ruber and I. isabellae. All spectra were taken using 514.5 nm excitation. The solid lines represent a fit of the data to two independent linear functions. The dashed line represents a fit of the data to a single line.

