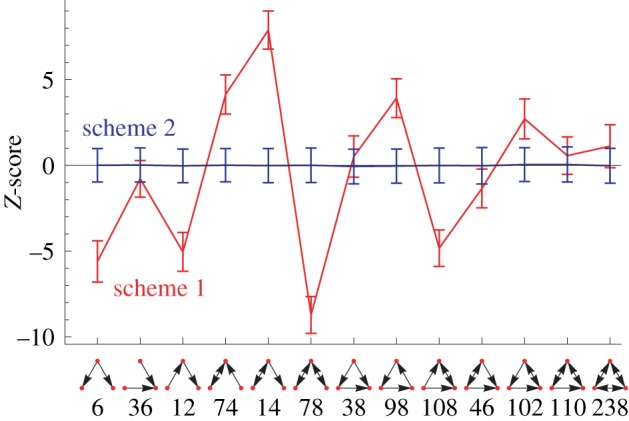
Figure 10.

Average Z-scores over 1000 layered random networks. The networks contain 20 input nodes, 50 middle nodes, 20 output nodes and with the probability of a link being present of 0.3. We show Z-scores resulting from a random ensemble that was created using standard switch randomization (scheme 1) and a curve obtained from switch randomization with the additional constraint of disallowing direct links between the input and the output layer (scheme 2). (Online version in colour.)
