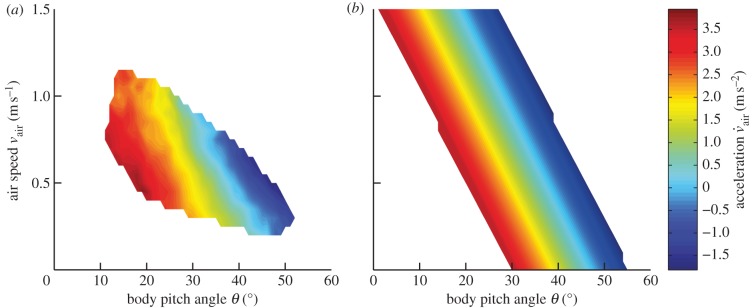
Figure 4.
Acceleration responses. (a) Pooled behavioural data. Horizontal acceleration is plotted in colour code as a function of pitch angle and air speed. Grid size is 1° and 0.05 m s−1. The figure represents a total of 284 trials, of which 191 were measured with step stimuli and 93 with sinusoidal stimuli. For each point on the grid, the median horizontal acceleration of each single measured flight trajectory was calculated by selecting the data in which the absolute vertical acceleration was smaller than 0.5 m s−2 (approx. 5% of the gravitational acceleration g, i.e. approx. 5% of the total vertical force) and the absolute vertical speed was smaller than 0.05 m s−1. The total mean acceleration was then computed by calculating the mean of the median accelerations of the single trajectories. For a point to be valid, the data from at least six different flights were required. (b) Model output. Output of the fitted model based on equation (3.1).

