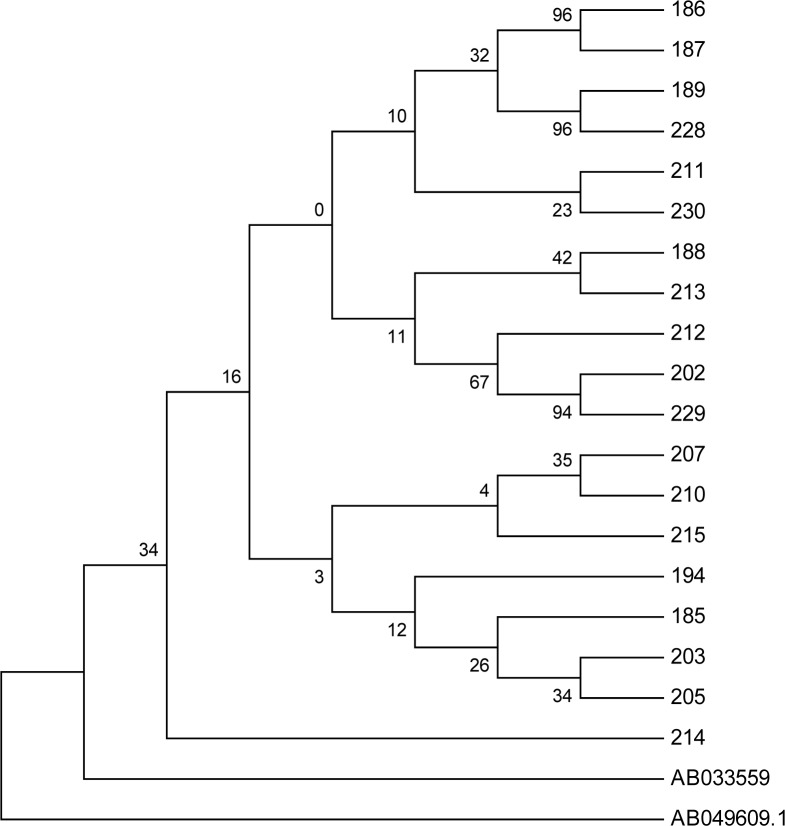
Fig. 1:
Neighbour joining phylogenetic trees of surface genes sequences from 19 samples. Note: S gene tree rooted with sequence AB049609 (reference genotype C).All Iranian isolates were compared to sequence AB033559 (reference genotype D, see the text). The figure shows bootstrap values of ≥70% and scale denotes percent diversity. Coding numbers indicate samples that have been analysed in the figure. The percentage of replicate trees in which the associated taxa clustered together in the bootstrap test (1000 replicates) are shown next to the branches. Branches corresponding to partitions reproduced in less than 50% bootstrap replicates are collapsedAlignment of complete nucleotide sequences of HBsAg from 19 sera.
Note: Nucleotides are numbered from the beginning of the HBsAg using the single letter code

