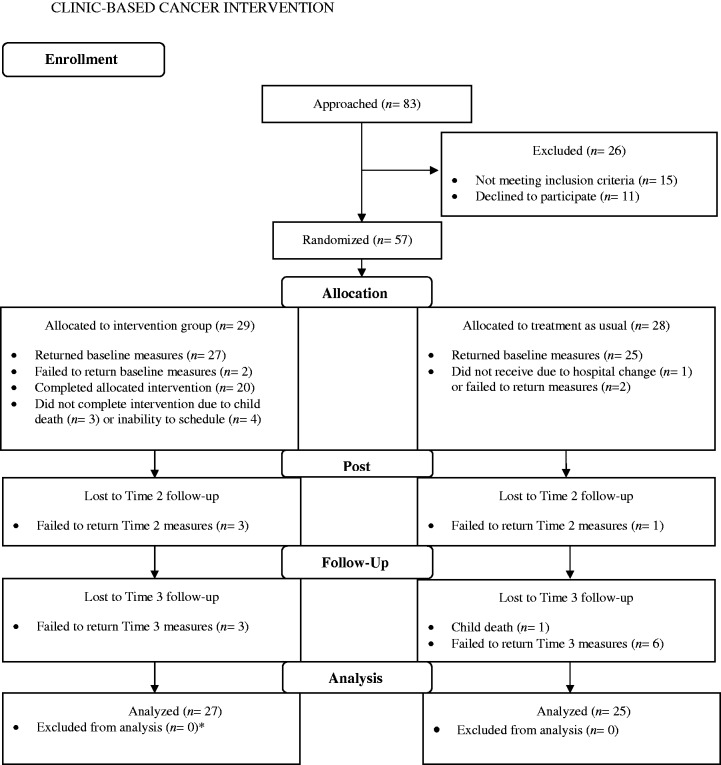
Figure 1.
Participant flow through the intervention.
Note. All cases were analyzed via growth curve modeling if participants provided any data. *Owing to missing data, the analyzed intervention group sample was slightly smaller (n = 26) for the Care of My Child With Cancer Scale, Impact of Events Scale-Revised, and Symptom Checklist 90-Revised outcomes.

