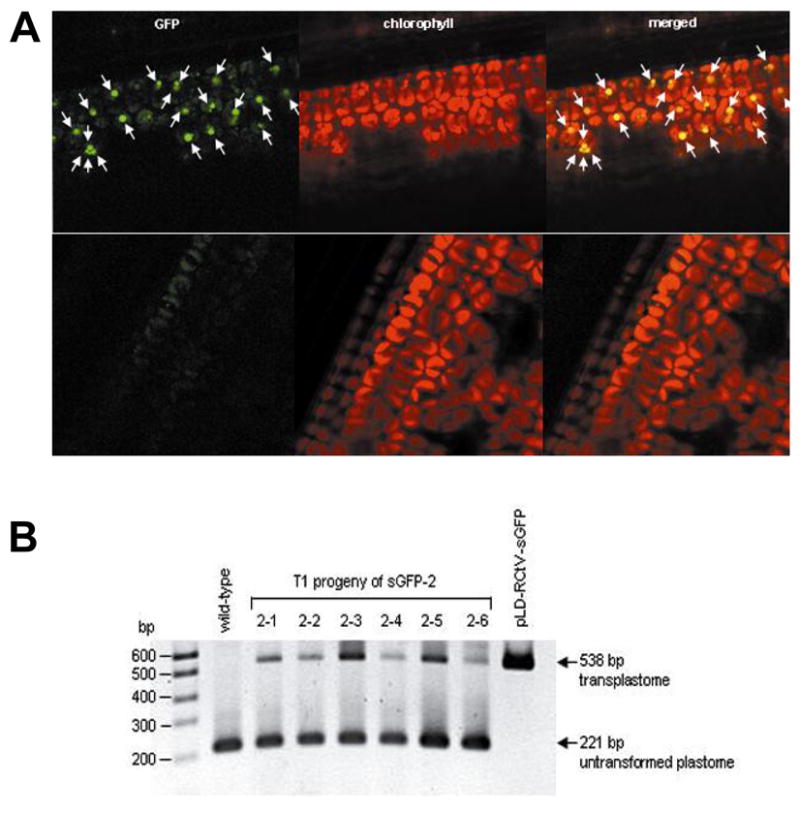
Fig. 5.

T1 progeny analyses. (A) Plastid-localized sGFP expression (marked with arrows) is observed from transplastomic line (top), whereas only a background level of autofluorescence is detectable from non-transformed plant (bottom) and (B) PCR analysis showing the presence of the 538 and 221 bp fragments, representing the transplastome and untransplastome, respectively.
