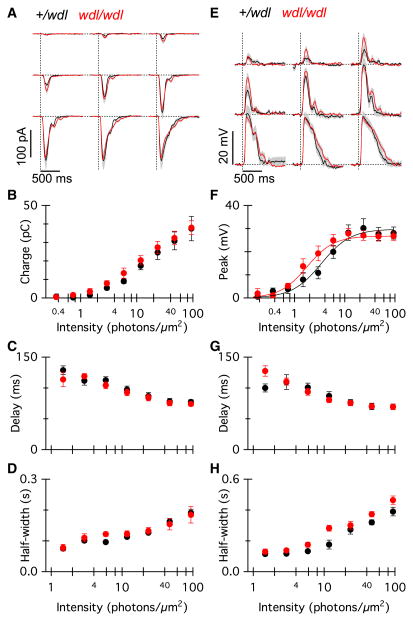
Fig. 6.
Light-evoked responses of RBCs are not altered in the wdl mutant. (A) Average flash-evoked EPSCs in RBCs from wdl/wdl (grey/red, n = 12) and wdl/+ littermates (black, n = 8). Individual flashes from each cell were averaged. The holding potential was −70 mV. Grey/red shading indicates ± 1 SEM. Flash strengths were 0.37, 0.73, 1.5, 2.9, 5.9, 11, 23, 47, 94 photons/μm2. (B–D) Total charge transfer (B), delay to half-maximum amplitude (C) and response half-width (D) for the current responses in wdl/+ (black) and wdl/wdl (grey/red) mice as a function of flash strength. The two lowest flash intensities are not included in the quantitative data shown in (C) and (D), due to large variability in these parameters resulting from response failures. (E) Average flash-evoked EPSPs from the same group of cells as (A–D). (F–H) Peak voltage (F), delay to half-maximum amplitude (G) and response half-width (H) for the voltage responses in wdl/+ (black) and wdl/wdl (grey/red) mice as a function of flash strength. Similar to (C) and (D), the two lowest flash intensities are not included in the quantitative data shown in (G) and (H). Error bars indicate ± 1 SEM. For interpretation of color references in figure legend, please refer to the Web version of this article.

