Fig. 8.
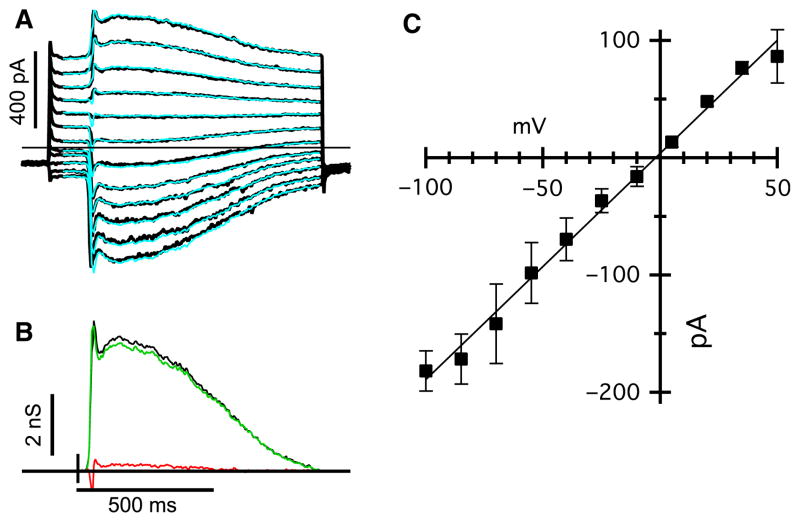
Light-evoked inputs to AII-ACs are linear in the wdl mutant mice. (A) Flash-evoked EPSCs in an AII-AC from a wdl/wdl animal. The holding potential was −70 mV. The superimposed cyan traces show the predicted currents reconstructed from the conductances shown below. (B) Excitatory (light grey/green) and inhibitory (dark grey/red) conductances required to account for the light-evoked currents shown above. The black shows the total conductance (excitation + inhibition) and indicates that the input can be accounted for almost entirely by excitation under these recording conditions. (C) Average current–voltage relation (± SEM) for four AII-ACs, including the one shown in (A) and (B). Before averaging, the individual current-voltage (IV) were normalized to the mean conductance for the data-set. The mean conductance was 2.0 ± 0.6 nS (n = 4). For interpretation of color references in figure legend, please refer to the Web version of this article.

